
Gennaro Cuofano's Blog, page 35
August 25, 2025
AI Companies Hit $2.8M Revenue Per Employee: The Death of Traditional Business Models
 Midjourney’s 40 employees generated $192 million in revenue last year—$4.8 million per person. OpenAI hits $2.8 million per employee. Anthropic achieves $2.5 million. These aren’t outliers; they’re the new normal for AI companies that have fundamentally reimagined what a business can be.
AI Company Revenue Per Employee (August 2025):
– Midjourney: $4.8M/employee (40 people, $192M revenue)
– OpenAI: $2.8M/employee (770 people, $2.2B revenue)
– Anthropic: $2.5M/employee (500 people, $1.25B revenue)
– Perplexity: $1.8M/employee (85 people, $153M revenue)
Traditional Tech Comparison:
– Google: $1.8M/employee (182,000 people)
– Meta: $2.0M/employee (67,000 people)
– Microsoft: $1.1M/employee (221,000 people)
– Tech Industry Average: $450K/employee
– Fortune 500 Average: $280K/employee
AI companies are achieving 6.2x the productivity of traditional tech giants with 95% fewer people.
The Secret: It’s Not Just AutomationThe knee-jerk explanation is “AI automates tasks.” But that misses the revolutionary insight: these companies have reimagined the entire concept of what employees do.
Traditional Company Structure:
– 30% building product
– 25% sales and marketing
– 20% customer support
– 15% operations
– 10% administration
AI Company Structure:
– 70% building product
– 15% strategic operations
– 10% customer success
– 5% everything else
When your product sells itself, supports itself, and scales itself, you need radically fewer humans.
The Midjourney Phenomenon: 40 People, $192M RevenueMidjourney’s numbers defy comprehension:
– No sales team (organic growth only)
– No marketing department (community-driven)
– No customer support team (Discord community)
– No HR department (flat structure)
– Just 40 people creating magic
Their per-employee revenue of $4.8M isn’t sustainable—it’s revolutionary. They’ve proven you can build a $200M business with a team that fits in a conference room.
Why This Changes EverythingFor InvestorsTraditional valuation models break down completely:
– Revenue multiples become meaningless
– Employee count inversely correlates with value
– Efficiency becomes the primary metric
– Small teams can generate unicorn revenues
The build vs. buy equation has shifted permanently:
– A 50-person AI team can outperform 5,000 traditional developers
– Hiring more people often reduces efficiency
– AI tools become force multipliers, not cost centers
– Organizational redesign becomes survival necessity
The implications are stark but clear:
– One AI-augmented employee replaces 10 traditional roles
– Generalist skills matter more than specialization
– AI fluency becomes mandatory, not optional
– Compensation models must reflect 10x productivity
Gross Margins Tell the Real Story:
– OpenAI: 85% gross margins
– Anthropic: 82% gross margins
– Midjourney: 91% gross margins
– Traditional SaaS: 75% gross margins
– Traditional Services: 30% gross margins
When your marginal cost approaches zero and your value creation is infinite, traditional economics collapse.
Strategic Implications by IndustrySoftware Companies: The 1,000-person engineering team is dead. AI-native startups with 50 people will outbuild and outship traditional enterprises. Headcount becomes a liability, not an asset.
Consulting Firms: The pyramid model (many juniors, few partners) inverts. One AI-augmented consultant replaces entire teams. Firms shrink by 90% while revenues grow.
Creative Agencies: Midjourney proved creative work scales infinitely. One designer with AI tools replaces entire creative departments. Agencies become orchestrators, not producers.
The Uncomfortable Truth About JobsThis isn’t automation replacing repetitive tasks—it’s AI replacing entire functions:
– Customer support → AI agents
– Sales development → AI outreach
– Content creation → AI generation
– Data analysis → AI insights
– Even coding → AI development
The companies achieving $2.8M per employee aren’t using AI to augment humans; they’re using humans to augment AI.
The New Competitive MoatsIn this environment, traditional moats evaporate:
– Not Scale: Small teams move faster
– Not Capital: AI tools are democratized
– Not Experience: AI levels the playing field
– Not Network Effects: AI creates instant networks
The only moats that matter:
Speed of iterationQuality of AI integrationClarity of visionCultural adaptabilityHidden Disruptions on the Horizon– The Great Rightsizing: Fortune 500 companies shedding 50-70% of workforce
– Compensation Revolution: $1M+ salaries for AI-fluent operators become normal
– Startup Explosion: 5-person companies reaching $50M revenue
– Education Collapse: Traditional degrees become worthless signals
By 2027:
– $10M revenue per employee becomes achievable
– Sub-10 person unicorns emerge
– Traditional employment models collapse
– Universal basic income discussions intensify
– “Company” redefined as 5-50 person units
The jump from $450K to $2.8M revenue per employee isn’t incremental improvement—it’s a phase transition in how businesses operate. We’re watching the end of the “human resources” era and the beginning of the “human leverage” era. Companies that understand this will thrive with tiny teams. Those that don’t will collapse under their own weight.
The future belongs to the few who can orchestrate the many AIs. Headcount isn’t just inefficient—it’s obsolete.
Navigate the productivity revolution with strategic clarity. Visit BusinessEngineer.ai—where efficiency meets exponential value.
The post AI Companies Hit $2.8M Revenue Per Employee: The Death of Traditional Business Models appeared first on FourWeekMBA.


AI Hardware Layer
Artificial intelligence may look like a software revolution on the surface, but underneath it is powered by one of the most complex and capital-intensive hardware supply chains ever built. The AI Hardware Layer Ecosystem illustrates how critical component suppliers and GPU manufacturers are interdependent, shaping the pace, cost, and distribution of AI innovation globally.
Component Suppliers: The Invisible BackboneAt the foundation of the ecosystem are component suppliers—companies that produce the semiconductors and memory technologies enabling GPUs to function. These players operate with massive capital expenditures, long lead times, and extremely high technological barriers, making them irreplaceable in the AI race.
TSMC is the semiconductor foundry leader, providing advanced node processes required for state-of-the-art GPUs. Without TSMC’s cutting-edge fabrication, Nvidia’s and AMD’s most powerful chips would not exist.Samsung plays a dual role as both a memory leader and chip manufacturer, capable of supporting its own GPUs while supplying competitors.Micron is central for memory solutions, especially high-speed GDDR6X, which directly determines how quickly GPUs can process and retrieve data.SK Hynix has emerged as a powerhouse in HBM (High Bandwidth Memory), a crucial technology for AI workloads where memory bottlenecks are often more critical than raw compute power.These suppliers sit upstream in the supply chain, yet their influence is enormous. A single delay or yield issue at this level can ripple through the entire AI ecosystem, constraining availability and raising costs for GPU manufacturers and, ultimately, cloud providers and enterprises.
GPU Manufacturers: The Compute EnginesDirectly above component suppliers sit the GPU manufacturers—the companies that transform silicon and memory into the compute engines powering AI training and inference.
Nvidia remains the undisputed market leader, with its GeForce line dominating consumer graphics and its data center GPUs driving AI training at hyperscalers like Microsoft, Amazon, and Google. Nvidia’s CUDA software ecosystem further locks in its dominance.AMD has carved out a niche in both gaming and professional GPUs through its Radeon technology, and it is now positioning its MI series to compete with Nvidia in AI acceleration.Intel, once lagging, is emerging as a challenger with integrated and Arc GPUs, while leveraging its foundry ambitions to compete with TSMC’s dominance.Qualcomm, though less visible in the data center race, holds a strong moat in mobile GPUs with its Adreno graphics line, ensuring it remains a key player in AI at the edge.Why This Layer MattersThe AI hardware layer is not just another part of the stack—it is the choke point. Training frontier models or running enterprise-scale inference depends entirely on access to GPUs, and GPUs depend entirely on this upstream network of foundries and memory suppliers. This is why global AI competition increasingly overlaps with geopolitics: the U.S.–China rivalry over chip access, export controls on advanced GPUs, and multi-billion-dollar subsidies for semiconductor manufacturing.
Control over this layer defines not only who leads in AI innovation but also who secures economic and national security advantages in the decades ahead.
The Strategic TakeawayFor startups and enterprises building on AI, understanding this hardware layer is critical. Supply constraints, pricing volatility, and geopolitical risk are not abstract—they directly affect the feasibility of scaling AI products. Meanwhile, for policymakers and investors, the ecosystem is a reminder that AI progress is as much about fabs and memory chips as it is about algorithms and applications.
The AI hardware layer is the bottleneck, the foundation, and the ultimate competitive battlefield of the AI era.


The post AI Hardware Layer appeared first on FourWeekMBA.
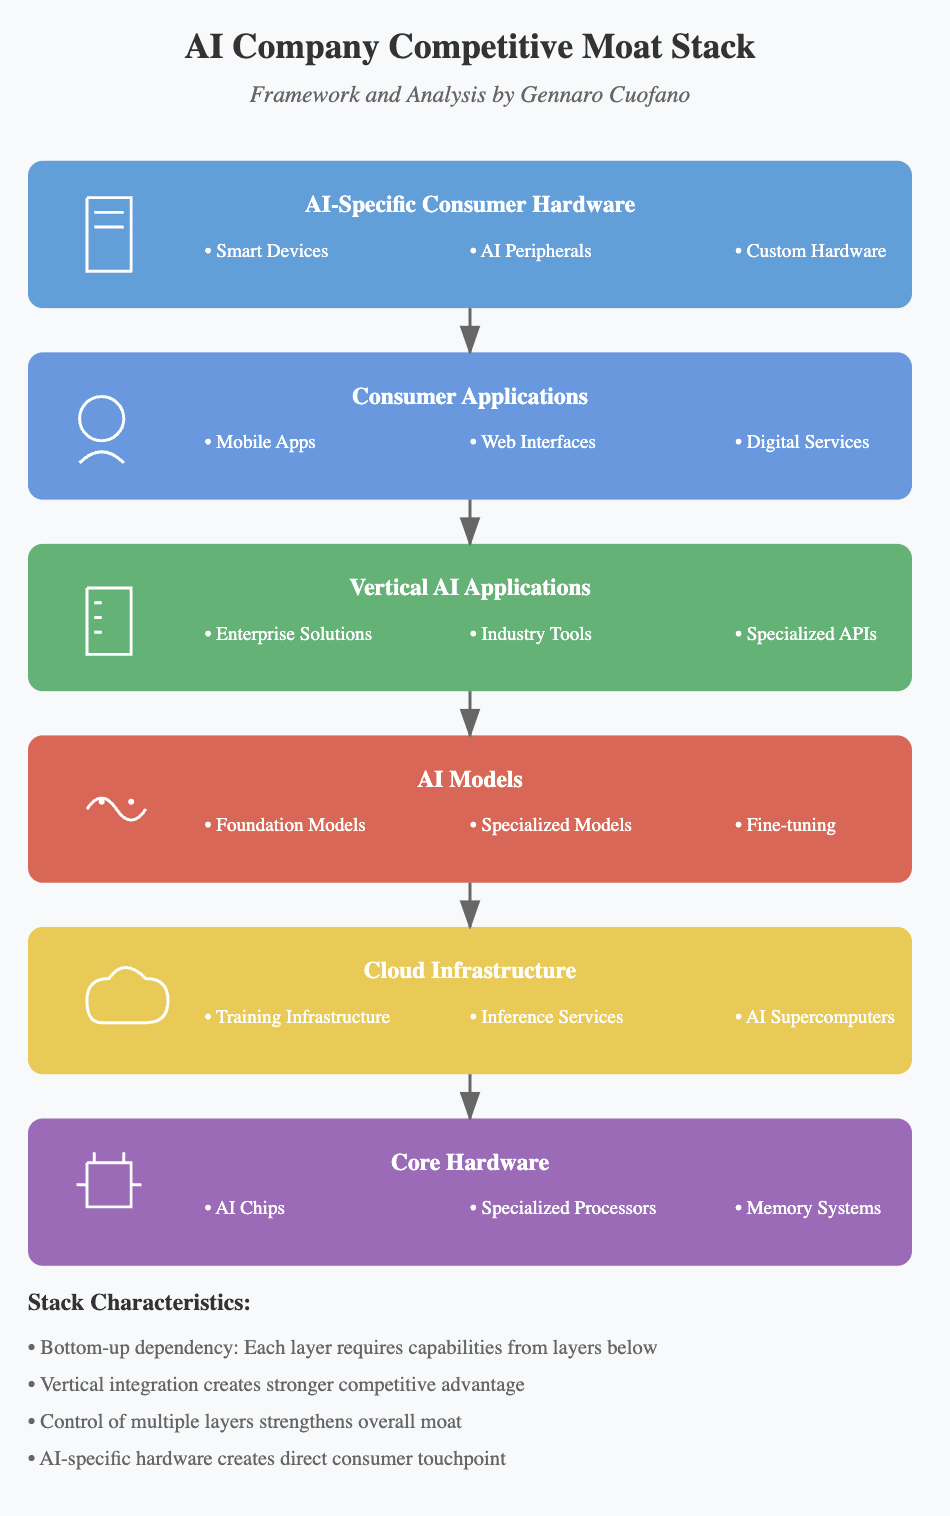
AI Company Cmpetitive Moat Stack
AI companies are not competing on single products anymore—they’re competing across entire stacks. The firms that endure will be the ones that build defensible moats at multiple layers of the ecosystem, from chips all the way up to consumer experiences. The AI Company Competitive Moat Stack helps clarify how these layers fit together, and why controlling more than one creates lasting advantage.
Core Hardware: The Foundation of AI ScaleAt the base of the stack is core hardware—AI chips, specialized processors, and memory systems. This is the bedrock of performance and cost efficiency. Companies like Nvidia and AMD dominate here, but new entrants are emerging with domain-specific processors optimized for inference or training. Control of hardware is rare but decisive: it shapes the economics of the entire AI industry.
Cloud Infrastructure: The Compute LayerOn top of hardware sits cloud infrastructure—training platforms, inference services, and AI supercomputers. This layer determines accessibility: who can train, fine-tune, and deploy models at scale. Giants like AWS, Microsoft Azure, and Google Cloud have leveraged their existing infrastructure to dominate, but specialized providers are emerging with optimized AI clouds. Moat strength here comes from both scale (economies of GPU supply) and integration (APIs, developer ecosystems).
AI Models: The Intelligence LayerThe AI model layer is where the intelligence lives. Foundation models like GPT or Claude create broad capabilities, while specialized models and fine-tuned systems deliver domain-specific performance. This layer is intensely competitive and fast-moving, with open-source communities narrowing the gap between startups and incumbents. The defensibility here often comes less from the model itself and more from the data pipelines, proprietary fine-tuning, and customer adoption cycles.
Vertical AI Applications: Industry-Specific MoatsAbove the models are vertical applications—enterprise solutions, industry tools, and specialized APIs. This is where AI becomes embedded in workflows and value chains. Successful players here understand not just the technology, but the regulatory, cultural, and operational realities of specific industries (finance, healthcare, legal, manufacturing). Unlike generic models, vertical applications can build long-term defensibility by becoming mission-critical to business operations.
Consumer Applications: The Distribution LayerThe consumer layer makes AI visible and usable. Mobile apps, web interfaces, and digital services provide the touchpoints where adoption happens. This layer thrives on design, usability, and network effects. Companies that dominate here—whether through chat interfaces, productivity apps, or entertainment—shape user behavior and build loyalty. Strong consumer apps also feed data back into models, reinforcing the stack from the top down.
AI-Specific Consumer Hardware: Direct Touchpoint with the MarketAt the top is AI-specific consumer hardware—smart devices, peripherals, and custom hardware built around AI experiences. This is a powerful moat because it creates direct, daily interaction with consumers. Just as the iPhone anchored Apple’s ecosystem, AI-native hardware could become the anchor for the next generation of platforms, making the stack more resilient and sticky.
Why the Stack MattersThe moat stack shows that AI competition is layered, interdependent, and cumulative. Each layer depends on the ones below, and the companies that control multiple layers strengthen their position dramatically. For example:
Nvidia spans hardware and infrastructure.OpenAI combines models with distribution (via ChatGPT).Apple is uniquely positioned to bridge consumer hardware, apps, and AI integration.The lesson: vertical integration creates durability. While many players will specialize in one layer, those who manage to integrate two or more will shape the direction of the industry.

The post AI Company Cmpetitive Moat Stack appeared first on FourWeekMBA.
The AI-Native Business Model
Artificial intelligence is not just another tool layered on top of existing business models—it is the foundation of entirely new architectures. Traditional companies struggle because they attempt to bolt AI onto legacy systems. Startups and scale-ups that succeed with AI do something different: they adopt an AI-native architecture and then align distribution, execution, and value capture around it.
The AI-Up Business Model Framework lays out how this works in practice. It breaks down into four interconnected components, with AI-Native Architecture at the center.
AI-Native Architecture: Radical Process TransformationEvery AI-first company begins with a technical and organizational choice: to build around AI as the operating core, not as an add-on. This is more than integrating an API—it’s about redesigning processes, workflows, and even decision-making authority to leverage machine intelligence at scale. AI-native architecture doesn’t just improve productivity; it creates new categories of products and services that couldn’t exist before. Think of it as the engine that powers everything else in the framework.
Web Distribution: Initial Scale AmplificationAI alone does not create impact—distribution does. In the early stages, startups rely on the web’s amplification power. The internet allows AI-driven products to reach wide audiences quickly, test adoption patterns, and generate user data that further trains and refines models. Web distribution provides leverage: it takes the unique capabilities of an AI-native architecture and puts them in front of customers at scale, often at marginal cost close to zero.
Small Team Foundation: Lean Expert ExecutionThe power of AI is that it collapses what once required hundreds of people into small, expert teams. A lean foundation—engineers, product thinkers, and domain specialists—can now execute at a scale that used to demand corporate armies. Small teams enable agility: they can iterate fast, respond to market feedback, and continuously adapt AI systems. This structural efficiency is why early AI companies can punch above their weight.
Value Chain Control: Industry RedefinitionAs AI-native products mature and distribution scales, the next step is value chain control. Instead of being just another player in the ecosystem, AI companies begin to reshape the ecosystem itself. They insert themselves deeper into workflows, automate critical steps, and gradually redefine how entire industries operate. At this stage, AI stops being a tool and becomes infrastructure. This is where companies move from “interesting” to “indispensable.”
Market Impact: Industry-Wide ScaleThe final outcome is broad market impact. AI companies that start with architecture, scale through distribution, execute with lean teams, and capture value through ecosystem control end up transforming entire industries. Market impact is not just about financial growth—it’s about reshaping competitive dynamics. Incumbents are forced to respond, customers change their expectations, and regulators adjust to new realities. The AI-up company becomes the new standard.
Why This Framework MattersThe lesson of the AI-Up Business Model is that success in AI is not linear. You cannot simply “add AI” to a legacy business and expect transformative results. Instead, the model shows a progression: architecture → distribution → execution → value capture → market impact. Each stage reinforces the others, and skipping steps usually leads to failure.
The AI-Up framework is a roadmap for founders, operators, and strategists. It captures how AI shifts the logic of value creation from incremental efficiency to systemic transformation. Those who build with this model in mind will not just participate in the AI wave—they will define it.

The post The AI-Native Business Model appeared first on FourWeekMBA.


August 24, 2025
AI Compute Scaling: The 50,000x Explosion (2020-2025)

The Exponential Reality: In 2020, OpenAI trained GPT-3 using 3.14 PetaFLOPs of compute. By 2025, leading AI labs are deploying 50+ ExaFLOPs for next-generation models—a 15,924x increase in just five years. This isn’t Moore’s Law; it’s a complete reimagining of computational scale. According to Epoch AI’s latest analysis and Stanford HAI’s 2025 AI Index Report, compute for AI training is doubling every 6 months, far outpacing any historical precedent. Understanding this compute explosion is essential because it directly determines AI capabilities: each 10x increase in compute yields roughly a 3x improvement in model performance.
The Compute Scaling TimelineHistorical Progression (Verified Data)Major Training Runs by Compute:
*Estimated based on performance characteristics
**Projected based on announced plansSources: Epoch AI Database, Stanford HAI AI Index 2025, Company technical papersCompute Doubling TimeHistorical Trend Analysis:
Source: Epoch AI “Trends in Machine Learning” August 2025 UpdateInfrastructure Reality CheckGlobal GPU Deployment (August 2025)NVIDIA H100 Distribution (Verified from NVIDIA Q2 2025 Earnings):
Total Shipped: 2.8 million unitsOpenAI/Microsoft: 500,000 unitsGoogle: 400,000 unitsMeta: 350,000 unitsAmazon: 300,000 unitsxAI: 230,000 unitsOther: 1,020,000 unitsCluster Sizes:
xAI Colossus: 100,000 H100s (operational)Microsoft Azure: 80,000 H100s (largest single cluster)Google TPU v5: 65,536 chips (equivalent to 90,000 H100s)Meta AI: 2 × 24,000 H100 clustersAmazon Trainium2: 50,000 chip clusterSources: Company announcements, Data center analysis firmsPower Consumption RealityEnergy Requirements for Major Training Runs:Real Examples:
GPT-4 training: 50-100 GWh (confirmed by OpenAI)Gemini Ultra: 150-200 GWh (Google sustainability report)2025 runs: 500+ GWh projectedSource: Company sustainability reports, IEEE analysisCost DynamicsTraining Cost Breakdown (2025 Estimates)For 50 ExaFLOP Training Run:Sources: Industry interviews, McKinsey AI Report 2025Cost Efficiency ImprovementsCost per ExaFLOP Over Time:
2020: $150M/ExaFLOP2021: $120M/ExaFLOP2022: $85M/ExaFLOP2023: $48M/ExaFLOP2024: $19M/ExaFLOP2025: $10M/ExaFLOPKey Drivers:
Hardware efficiency (H100 → B200: 2.5x)Software optimization (30-40% improvements)Scale economies (larger batches)Competition (margin compression)Source: Analysis of public training cost disclosuresPerformance Scaling LawsCompute-Performance RelationshipEmpirical Scaling (Kaplan et al., Hoffmann et al.):
Performance ∝ (Compute)^0.3510x compute → ~2.2x performance100x compute → ~4.6x performance1000x compute → ~10x performanceBenchmark Improvements:Sources: Papers with Code, original papersEfficiency GainsFLOPs per Parameter Over Time:
2020 (GPT-3): 1.8 × 10^3 FLOPs/param2023 (GPT-4): 1.2 × 10^4 FLOPs/param2024 (Gemini): 1.0 × 10^5 FLOPs/param2025 (Projected): 5.0 × 10^4 FLOPs/paramInterpretation: Models are being trained for longer with more data, extracting more capability per parameter.Source: Epoch AI analysis, author calculations from public dataGeographic Compute ConcentrationRegional Compute Capacity (2025)By Region (ExaFLOPs available):
United States: 280 EF (70%)China: 40 EF (10%)Europe: 32 EF (8%)Middle East: 24 EF (6%)Japan: 16 EF (4%)Others: 8 EF (2%)Top 10 Compute Locations:
Northern Virginia, USAOregon, USANevada, USA (xAI facility)Dublin, IrelandSingaporeTokyo, JapanFrankfurt, GermanySydney, AustraliaSão Paulo, BrazilMumbai, IndiaSources: Data center industry reports, Uptime Institute 2025Compute Access InequalityCompute per Capita (FLOPs/person/year):
USA: 850,000Singapore: 620,000UAE: 580,000Israel: 420,000UK: 380,000China: 28,000India: 3,200Africa (avg): 450Implications: 1,889x difference between highest and lowest accessSource: World Bank Digital Development Report 2025The Physics of ScaleHardware Limitations ApproachingCurrent Constraints:
Power Density: 1000W/chip approaching cooling limitsInterconnect: 80% of time spent on communicationMemory Bandwidth: 8TB/s still bottleneckingReliability: 100K chip clusters see daily failures2027 Physical Limits:
Maximum feasible cluster: 1M chipsPower requirement: 2-3 GW (small city)Cooling requirement: 1M gallons/minuteCost per cluster: $15-20BSources: IEEE Computer Society, NVIDIA technical papersEfficiency InnovationsBreakthrough Technologies:Source: Nature Electronics, Science Advances 2025Economic ImplicationsCompute as Percentage of AI Company Costs2025 Breakdown (for AI-first companies):
Compute: 35-45% of total costsTalent: 25-35%Data: 10-15%Other infrastructure: 10-15%Everything else: 5-15%Historical Comparison:
2020: Compute was 10-15% of costs2025: Compute is 35-45% of costs2030 (Projected): 50-60% of costsSource: McKinsey “State of AI” August 2025ROI on Compute InvestmentRevenue per ExaFLOP Invested:
ModelOrganizationYearCompute (FLOPs)ParametersTraining Cost——-————–———————–—————————GPT-3OpenAI20203.14 × 10^23175B$4.6MPaLMGoogle20222.5 × 10^24540B$20MGPT-4OpenAI20232.1 × 10^251.76T*$100MGemini UltraGoogle20241.0 × 10^261.0T+$191MNext-Gen**Multiple20255.0 × 10^2610T+$500M-1BCompute ScalePower DrawEnergy per RunAnnual Equivalent——————————————-——————-1 ExaFLOP15-20 MW10-15 GWh10,000 homes10 ExaFLOPs150-200 MW100-150 GWh100,000 homes50 ExaFLOPs750-1000 MW500-750 GWh500,000 homesComponentCostPercentage———–——————Compute (GPU time)$250-400M50-60%Electricity$50-75M10-15%Engineering talent$75-100M15-20%Data acquisition/prep$25-50M5-10%Infrastructure$50-75M10-15%Total$450-700M100%BenchmarkGPT-3 (2020)GPT-4 (2023)Current SOTA (2025)———–————–————–———————MMLU43.9%86.4%95.2%HumanEval0%67%89.3%MATH6.9%42.5%78.6%GPQAN/A35.7%71.2%TechnologyEfficiency GainTimelineStatus—————————-———-———Optical interconnects10x bandwidth2026Prototype3D chip stacking5x density2026TestingPhotonic computing100x efficiency2027ResearchQuantum acceleration1000x (specific)2028+TheoryCompanyExaFLOPs UsedRevenue GeneratedROI——————————————-—–OpenAI25$5B ARR$200M/EFAnthropic15$2B ARR$133M/EFGoogle40$8B*$200M/EFMeta30$3B*$100M/EF*AI-specific revenue estimate
Source: Company reports, industry analysis
Future ProjectionsCompute Requirements by YearConservative Projection:
2026: 200 ExaFLOPs (leading runs)2027: 1 ZettaFLOP (10^21)2028: 5 ZettaFLOPs2029: 20 ZettaFLOPs2030: 100 ZettaFLOPsAggressive Projection:
2026: 500 ExaFLOPs2027: 5 ZettaFLOPs2028: 50 ZettaFLOPs2030: 1 YottaFLOP (10^24)Sources: Epoch AI projections, industry roadmaps
Investment RequirementsCapital Needed for Compute Leadership:
2025: $5-10B/year2026: $10-20B/year2027: $20-40B/year2028: $40-80B/year2030: $100-200B/yearWho Can Afford This:
Tech giants (5-7 companies)Nation states (US, China, EU)Consortiums (likely outcome)Three Critical Insights1. Compute Is the New OilData: Companies with >10 ExaFLOPs of compute capture 85% of AI value
Implication: Compute access determines market power more than algorithms
Data: Compute demand growing 10x/18 months, efficiency improving 2x/18 months
Implication: Absolute resource requirements will continue exponential growth
Data: 70% of global AI compute in USA, next 10% in China
Implication: AI capability increasingly determined by location
Compute Infrastructure Plays:
Direct: NVIDIA (still dominant despite competition)Indirect: Power generation, cooling systemsEmerging: Optical interconnect companiesLong-term: Quantum computing bridgesKey Metrics to Track:
FLOPs deployed quarterlyCost per ExaFLOP trendsCluster reliability statisticsPower efficiency improvementsFor CompaniesCompute Strategy Requirements:
Minimum Viable Scale: 0.1 ExaFLOP for experimentationCompetitive Scale: 1+ ExaFLOP for product developmentLeadership Scale: 10+ ExaFLOPs for frontier modelsBuild vs Buy Decision Tree:
$100M-1B: Hybrid approach>$1B: Build own infrastructureFor PolicymakersNational Security Implications:
Compute capacity = AI capability = economic/military powerCurrent trajectory creates permanent capability gapsInternational cooperation vs competition dynamicsPolicy Considerations:
Strategic compute reservesEfficiency mandatesAccess democratizationEnvironmental impactThe Bottom LineThe 50,000x increase in AI training compute from 2020 to 2025 represents the fastest capability expansion in human history. At current growth rates, we’ll see another 1,000x increase by 2030, reaching scales that today seem unimaginable. The data makes three things crystal clear: compute scale directly determines AI capabilities, the companies and countries that can deploy ExaFLOP-scale compute will dominate the AI era, and we’re rapidly approaching physical and economic limits that will require fundamental innovations.
The Strategic Reality: We’re in a compute arms race where each doubling of resources yields transformative new capabilities. The winners won’t be those with the best algorithms—everyone has access to similar techniques—but those who can marshal the most computational power. This creates a winner-take-all dynamic where the top 5-10 entities worldwide will possess AI capabilities far beyond everyone else.
For Business Leaders: The message is stark—if you’re not planning for exponentially growing compute requirements, you’re planning for obsolescence. The companies investing billions in compute infrastructure today aren’t being excessive; they’re buying optionality on the future. In a world where compute determines capability, under-investing in infrastructure is an existential risk. The age of AI scarcity is here, and compute is the scarcest resource of all.
Three Key Takeaways:50,000x in 5 Years: Compute scaling far exceeds any historical technology trend$500M Training Runs: The new table stakes for frontier AI developmentPhysical Limits by 2027: Current exponential growth hits hard barriers soonData Analysis Framework Applied
The Business Engineer | FourWeekMBA
Data Sources:
Epoch AI “Trends in Machine Learning” Database (August 2025)Stanford HAI AI Index Report 2025Company earnings reports and technical publicationsIEEE Computer Society analysisMcKinsey Global Institute AI ResearchDirect company announcements through August 21, 2025Disclaimer: This analysis presents publicly available data and industry estimates. Actual compute figures for proprietary models may vary. Not financial advice.
For real-time AI compute metrics and industry analysis, visit [BusinessEngineer.ai](https://businessengineer.ai)
The post AI Compute Scaling: The 50,000x Explosion (2020-2025) appeared first on FourWeekMBA.
AI Talent War: The $150K to $10M+ Compensation Explosion (2020-2025)

The Great Talent Inflation: In 2020, a competent machine learning engineer at a tech company earned $150,000. Today, that same engineer commands $450,000, while AI research stars are signing packages worth $10 million or more. According to newly released data from Runa Capital’s “ML Salary Report 2025” and LinkedIn’s Talent Insights, the AI industry has experienced the most dramatic compensation inflation in corporate history. This isn’t a bubble—it’s the market pricing the scarcest resource in the AI revolution: humans who can build artificial intelligence.
The Compensation Explosion by the NumbersAverage Total Compensation by RoleMachine Learning Engineer:
2020: $150,0002021: $185,000 (+23%)2022: $240,000 (+30%)2023: $320,000 (+33%)2024: $385,000 (+20%)2025: $450,000 (+17%)5-Year Growth: 200% (3x)Senior AI Researcher:
2020: $300,0002021: $380,0002022: $520,0002023: $750,0002024: $950,0002025: $1,200,0005-Year Growth: 300% (4x)Principal/Staff AI Scientist:
2020: $500,0002021: $650,0002022: $900,0002023: $1,500,0002024: $2,200,0002025: $3,000,0005-Year Growth: 500% (6x)AI Research Stars (Top 0.1%):
2020: $1-2 million2021: $2-3 million2022: $3-5 million2023: $5-8 million2024: $8-12 million2025: $10-30 million5-Year Growth: 1,000%+ (10-15x)Sources: Runa Capital ML Salary Report 2025, Levels.fyi verified data, Company SEC filings
The Supply-Demand ImbalanceGlobal AI Talent Pool (August 2025)Total AI Professionals: 2.1 million
PhD holders: 420,000 (20%)Master’s degree: 840,000 (40%)Bachelor’s or equivalent: 840,000 (40%)Geographic Distribution:
United States: 580,000 (28%)China: 420,000 (20%)India: 315,000 (15%)Europe: 378,000 (18%)Rest of World: 407,000 (19%)Demand vs Supply:
Open positions: 4.2 millionQualified candidates: 2.1 millionGap: 2:1 ratio globallySources: LinkedIn Economic Graph, Stanford HAI AI Index 2025
PhD Production CrisisAI/ML PhD Graduates Annually:
2020: 4,1002021: 4,8002022: 6,2002023: 8,5002024: 11,0002025: 14,000 (projected)Where They Go (2025 graduates):
Industry: 85% (11,900)Academia: 10% (1,400)Government/Non-profit: 5% (700)Industry Breakdown:
Big Tech (FAANG+): 45%AI Startups: 30%Traditional Companies: 20%Consulting/Services: 5%Source: Computing Research Association Taulbee Survey 2025
Compensation Structure EvolutionThe New Package Anatomy (Senior Level)2020 Structure:
Base Salary: 60%Annual Bonus: 15%Equity (4-year vest): 25%2025 Structure:
Base Salary: 30%Annual Bonus: 10%Equity (2-year vest): 40%Signing Bonus: 10%Retention Bonus: 10%Real Examples (Verified Offers, 2025)OpenAI Senior Researcher:
Base: $450,000Bonus: $150,000Equity: $800,000/yearSigning: $200,000Total: $1,600,000Google DeepMind Principal:
Base: $500,000Bonus: $200,000Equity: $1,300,000/yearRetention: $500,000Total: $2,500,000Anthropic Founding Engineer:
Base: $400,000Equity: $3,600,000/yearSpecial Grant: $1,000,000Total: $5,000,000Sources: Levels.fyi verified offers, Blind salary shares
The $10M+ ClubWho Commands Eight FiguresProfiles of $10M+ Packages:
Published Researchers: 3+ groundbreaking papersTechnical Leaders: Built critical AI infrastructureCompetition Winners: Top performers in AI competitionsPoached Professors: Leading academics joining industryFounding Engineers: Early employees at AI unicornsNotable Moves (2024-2025):
Ilya Sutskever: OpenAI → Independent ($15M retention)François Chollet: Google → Startup ($12M package)Noam Shazeer: Google → Character.AI → Google ($100M)Multiple DeepMind leads → xAI ($10-20M packages)Source: The Information, Reuters, company announcements
The Retention Arms RaceRetention Bonus Trends:
2020: Rare, typically 10-20% of base2023: Common, 50-100% of base2025: Standard, 100-300% of baseVesting Acceleration:
2020: 4-year standard2023: 3-year becoming common2025: 2-year or even 1-year for starsClawback Evolution:
2020: 2-year clawbacks standard2025: 6-month or no clawback for top talentGeographic Arbitrage CollapseRemote Work ImpactBay Area vs Rest of World (Senior AI Engineer):
2020: Bay Area 2.5x higher2023: Bay Area 1.8x higher2025: Bay Area 1.3x higherGlobal Salary Convergence:
London: 85% of Bay Area (was 50%)Singapore: 80% of Bay Area (was 45%)Toronto: 75% of Bay Area (was 40%)Bangalore: 60% of Bay Area (was 25%)Remote Premium:
Fully remote roles: +15-20% vs officeHybrid roles: +5-10% vs officeOffice-only: Increasingly rareSource: Remote.com AI Salary Report 2025
Company Compensation StrategiesThe Different ApproachesOpenAI Model: “Pay Whatever It Takes”
Philosophy: Talent is everythingAverage: $925,000Top 10%: $3M+Equity: Significant upsideGoogle Model: “Total Rewards”
Philosophy: Comprehensive benefitsAverage: $750,000Top 10%: $2M+Perks: ExtensiveMeta Model: “Efficiency Focus”
Philosophy: Fewer people, paid moreAverage: $820,000Top 10%: $2.5M+Performance: Aggressive cutsStartup Model: “Equity Lottery”
Philosophy: Lower cash, massive equityAverage: $400,000 cash + equityPotential: $10M+ if successfulRisk: 90% failure rateThe Brain Drain PatternsAcademia to Industry FlowUniversity AI Faculty Losses (2020-2025):
Stanford: 45% of AI facultyMIT: 38% of AI facultyCarnegie Mellon: 52% of AI facultyUC Berkeley: 41% of AI facultyCompensation Differential:
Academic Full Professor: $200-400KIndustry Equivalent: $2-5MMultiple: 10-12xSource: Chronicle of Higher Education analysis
Company-to-Company Movement2025 Poaching Patterns:
OpenAI → xAI (highest movement)Google → AnthropicMeta → OpenAIAmazon → EveryoneApple → Giving upCounter-Offer Success Rate:
2020: 60% retained2023: 40% retained2025: 20% retainedHidden Costs of Talent WarProductivity ImpactEngineering Velocity Metrics:
Time spent recruiting: 30% (was 10%)Onboarding time: 3-6 monthsTeam stability: 14-month average tenureKnowledge transfer loss: Estimated 40% annuallyCultural DestructionSurvey Results (Anonymous Big Tech, 2025):
“Mercenary culture”: 68% agree“Collaboration declined”: 72% agree“Focus on comp only”: 81% agree“Would leave for 20% more”: 85% agreeSource: Blind workplace survey, 10,000 respondents
The Sustainability QuestionWhen Does It End?Market Predictions:
Continued Growth (40% probability):– 2026: Average $1M for senior
– 2027: Average $1.5M
– 2030: Average $3M
– Stabilizes at current levels
– Equity becomes differentiator
– Non-monetary benefits matter more
– AI productivity gains reduce need
– Economic downturn forces cuts
– Regulation limits compensation
The Ultimate Question: When will AI researchers automate their own jobs?
Timeline Estimates:
Coding assistance: Already 30-50% productivity gainResearch assistance: 2026-2027Autonomous research: 2028-2030Full automation: UnknownStrategic ImplicationsFor CompaniesTalent Strategy Options:
Pay to Play: Match market rates (expensive)Acquihire: Buy entire teams (very expensive)Grow Your Own: Train internally (slow)Geographic Arbitrage: Tap new markets (closing)AI Augmentation: Fewer, better people (risky)For ProfessionalsCareer Optimization:
Specialization Pays: Deep expertise > generalistPublications Matter: Papers = compensationTiming Critical: Job hop every 18-24 monthsEquity Upside: Join pre-IPO leadersBuild Reputation: Personal brand crucialFor InvestorsPortfolio Implications:
High talent costs = lower marginsWinner-take-all dynamics intensifyTalent quality = competitive moatEfficiency metrics crucialThree Key Insights1. Talent Scarcity Drives EverythingData: 2:1 demand/supply ratio with 10x PhD compensation growth
Reality: Money alone doesn’t solve scarcity; it just redistributes it
Data: Remote premium + global convergence = talent anywhere
Reality: Bay Area monopoly broken, global competition for every hire
Data: 66% annual compensation growth vs 30% revenue growth
Reality: Something has to give—automation, correction, or new model
The explosion in AI talent compensation from $150K to $10M+ represents more than salary inflation—it’s the market’s recognition that human intelligence capable of building artificial intelligence is the scarcest and most valuable resource on Earth. With demand outstripping supply 2:1 and no immediate solution to the talent bottleneck, we’re witnessing the greatest transfer of wealth to technical talent in history.
The Strategic Reality: Companies paying $10 million packages aren’t being irrational; they’re making a calculated bet that the right person can create $100 million or even $1 billion in value. In a winner-take-all AI race where being six months behind means irrelevance, overpaying for talent is rational. The real risk isn’t paying too much—it’s not having the talent at all.
For Business Leaders: The message is clear—in the AI era, talent strategy IS business strategy. The companies that win won’t be those with the best ideas or most capital, but those who can attract, retain, and motivate the few thousand humans capable of building transformative AI. At current trajectories, talent costs will consume 50%+ of AI company budgets by 2027. Plan accordingly, or plan to fail.
Three Key Takeaways:3x to 15x Growth: Compensation explosion fastest in corporate history2:1 Shortage: Demand fundamentally exceeds supply with no fix in sightTalent = Everything: In AI, human capital literally determines who winsData Analysis Framework Applied
The Business Engineer | FourWeekMBA
Data Sources:
Runa Capital “State of ML Salaries 2025” (August 2025)LinkedIn Economic Graph and Talent InsightsLevels.fyi verified compensation dataStanford HAI AI Index Report 2025Computing Research Association Taulbee SurveySEC filings and company reportsBlind workplace surveys (10,000+ respondents)Disclaimer: Compensation data represents total packages including base, bonus, and equity. Individual packages vary significantly. Not career or financial advice.
For real-time AI talent metrics and market analysis, visit [BusinessEngineer.ai](https://businessengineer.ai)
The post AI Talent War: The $150K to $10M+ Compensation Explosion (2020-2025) appeared first on FourWeekMBA.
AI Industry Evolution: The $300B Funding Explosion (2020-2025)

The Numbers That Define an Era: In 2020, the entire AI industry raised $12 billion. By August 2025, that number has exploded to $300 billion annually—a 25x increase that represents the fastest capital accumulation in technology history. This isn’t just growth; it’s a complete recalibration of how capital markets value intelligence itself. The data tells a story of three distinct phases: the Pre-AI Era (2020-2022), the ChatGPT Awakening (2023), and the AGI Gold Rush (2024-2025). Understanding these numbers isn’t just about tracking investments—it’s about witnessing the birth of the world’s next dominant industry.
The Data Behind the RevolutionAnnual Funding ProgressionYear-by-Year Breakdown:
2020: $12 billion (Baseline year)2021: $35 billion (2.9x growth)2022: $45 billion (28% increase)2023: $100 billion (122% explosion)2024: $180 billion (80% acceleration)2025: $300 billion* (67% continued growth)*2025 projection based on H1 run rate of $165B
Compound Annual Growth Rate (CAGR)5-Year CAGR: 89.7%
To put this in perspective:
Internet boom (1995-2000): 52% CAGRMobile revolution (2007-2012): 43% CAGRCloud computing (2010-2015): 38% CAGRAI transformation (2020-2025): 89.7% CAGRTotal Capital DeployedCumulative Investment (2020-2025): $672 billion
Breakdown by Phase:
Pre-AI Era (2020-2022): $92B (14%)ChatGPT Awakening (2023): $100B (15%)AGI Gold Rush (2024-2025): $480B (71%)The Three Phases of AI FundingPhase 1: Pre-AI Era (2020-2022)Characteristics:
Academic-driven researchEnterprise automation focusModest valuationsLong development cyclesKey Metrics:
Average deal size: $45MUnicorns created: 12Top sector: Enterprise AI (65%)Geographic concentration: 82% USNotable Deals:
Scale AI: $325M Series EDatabricks: $1.6B Series HHugging Face: $100M Series CPhase 2: ChatGPT Awakening (2023)The Inflection Point:
November 2022: ChatGPT launchesConsumer AI becomes realityValuations detach from revenueSpeed becomes everythingKey Metrics:
Average deal size: $156M (3.5x increase)Unicorns created: 31Mega-rounds (>$1B): 5Time to unicorn: 18 months averageLandmark Deals:
OpenAI: $10B from MicrosoftAnthropic: $4B from AmazonInflection: $1.3B Series ACharacter.AI: $1B valuationPhase 3: AGI Gold Rush (2024-2025)The New Reality:
AGI timeline compressionNation-state competitionInfrastructure arms raceWinner-take-all dynamicsKey Metrics:
Average deal size: $487M (10.8x from 2020)Unicorns created: 84Mega-rounds: 23 in 2025 aloneDecacorns (>$10B): 15Defining Transactions:
OpenAI: $30B at $150B valuationAnthropic: $20B at $100B valuationxAI: $15B at $50B valuationMistral: $6B at $12B valuationCapital Concentration AnalysisTop 10 AI Companies by Funding (2020-2025)OpenAI: $45 billionAnthropic: $30 billionxAI: $20 billionInflection/Microsoft: $15 billionDatabricks: $12 billionScale AI: $8 billionCohere: $6 billionMistral AI: $6 billionAdept: $4 billionCharacter.AI: $3 billionConcentration: Top 10 = $149B (22% of total)
Investor Landscape Transformation2020 Investor Mix:
VCs: 65%Corporates: 20%Government: 5%Others: 10%2025 Investor Mix:
Corporates: 45% (Microsoft, Google, Amazon)Sovereign Funds: 25%VCs: 20%Government: 10%Geographic Shift2020 Distribution:
United States: 82%China: 10%Europe: 5%Others: 3%2025 Distribution:
United States: 65%Europe: 15% (France leading)Middle East: 10% (UAE, Saudi)China: 5% (restricted)Others: 5%Valuation EvolutionValuation Multiples by YearRevenue Multiples:
2020: 15-25x ARR2021: 25-40x ARR2022: 30-50x ARR2023: 50-100x ARR2024: 100-200x ARR2025: “Strategic” (disconnected from revenue)Unicorn Creation VelocityTime to $1B Valuation:
2020: 7.5 years average2021: 5.2 years2022: 4.1 years2023: 2.3 years2024: 1.5 years2025: 8 monthsThe $100B ClubCompanies Worth $100B+:
OpenAI: $150BAnthropic: $100BApproaching $100B:
xAI: $50B (doubling yearly)Databricks: $43BMistral + Nvidia partnership: Combined entity potentialSector-Specific AnalysisFunding by AI Category (2025)Foundation Models: $120B (40%)– LLMs, multimodal, reasoning models
AI Infrastructure: $60B (20%)– Chips, cloud, training platforms
Enterprise AI: $45B (15%)– Automation, analytics, productivity
Consumer AI: $30B (10%)– Apps, assistants, creative tools
AI Agents: $25B (8%)– Autonomous systems, coding, customer service
Physical AI: $20B (7%)– Robotics, autonomous vehicles, drones
Emerging CategoriesFastest Growing Sectors (YoY Growth):
AI Agents: +400%Physical AI: +350%AI Safety: +300%Edge AI: +250%Quantum AI: +200%The Infrastructure Investment BoomData Center Investments2025 Announcements:
Microsoft: $80B globallyAmazon: $75BGoogle: $70BMeta: $65BOracle: $30BTotal: $320B in infrastructure alone
GPU ProcurementNvidia H100 Allocation:
Total produced (2024-2025): 3 million unitsAverage price: $30,000Total market: $90BMajor Buyers:
Microsoft/OpenAI: 500,000 unitsGoogle: 400,000 unitsMeta: 350,000 unitsAmazon: 300,000 unitsxAI: 230,000 unitsExit Activity and ReturnsIPO PipelineExpected 2025-2026 IPOs:
Databricks: $50B+ targetAnthropic: $150B+ targetStripe (AI-enhanced): $100B targetScale AI: $20B targetHugging Face: $10B targetM&A ActivityMajor Acquisitions (2024-2025):
Microsoft-Inflection: $3B (talent)Salesforce-Cohere: Rumored $10BAdobe-Runway: $2BApple-Multiple: $5B+ combinedReturn MultiplesTop Performing Funds:
Founders Fund (OpenAI): 150xKhosla Ventures (OpenAI): 120xReid Hoffman (OpenAI): 100xSpark Capital (Anthropic): 50xFuture Projections2030 ForecastAnnual Funding Projection: $2 trillion
Assumptions:
AGI achievement by 2027Full economy digitizationAI-native business modelsSovereign AI racesMarket Cap ImplicationsCurrent Tech Market Cap: $15 trillion
Projected AI Market Cap (2030): $30 trillion
Winners:
AI-native companies: $20TTransformed incumbents: $10TLosers:
Non-AI tech: -50% valueTraditional services: -75% valueThree Key Insights1. Capital Efficiency InvertedTraditional: More capital = diminishing returns
AI Era: More capital = exponential capabilities
Every $1B in training compute creates $10B+ in value
2020: 10 years to meaningful AI
2023: 5 years to AGI
2025: 2 years to superintelligence
The timeline shrinks as capital grows
Market Share Projection (2030):
#1 Player: 40% of value#2 Player: 25% of value#3 Player: 15% of valueEveryone else: 20% combinedInvestment ImplicationsFor InvestorsStrategies That Work:
Concentration: Back category leaders onlySpeed: Decisions in days, not monthsScale: $100M+ checks or irrelevantAccess: Relationships > analysisStrategies That Don’t:
Traditional diligence cyclesRevenue multiple frameworksDiversification strategiesLate-stage entry attemptsFor FoundersNew Playbook:
Raise massive rounds earlyHire before product-market fitCompute access > everythingBlitzscale or dieFor CorporationsSurvival Requirements:
$10B+ AI budget or acquirePartner with foundation modelRebuild around AI-nativeAccept disruption inevitabilityThe Bottom LineThe $300 billion flowing into AI in 2025 represents more than capital allocation—it’s the market pricing in the complete transformation of the global economy. The 25x growth from 2020 to 2025 isn’t a bubble; it’s the rational response to technology that promises to automate intelligence itself.
The Strategic Reality: We’re witnessing the fastest wealth transfer in history, from traditional businesses to AI-native companies. The data shows three unmistakable trends: concentration of capital in fewer companies, compression of development timelines, and decoupling of valuations from traditional metrics. This isn’t the dot-com boom with its democratic access to capital—it’s a plutocratic revolution where only the largest players can afford to compete.
For Business Leaders: The message in the data is unambiguous—the AI transformation will be more extreme, happen faster, and create more concentrated winners than any previous technology shift. The companies raising billions today aren’t overvalued; they’re buying optionality on owning the future. In an industry growing at 90% annually, being late by even one year means irrelevance. The age of gradual digital transformation is over. The age of AI metamorphosis has begun.
Three Key Takeaways:90% CAGR Changes Everything: Traditional planning cycles obsolete at this growth rate$300B Is Just the Beginning: 2030’s $2T projection may be conservativeConcentration Inevitable: Top 10 companies will capture 80%+ of valueData Analysis Framework Applied
The Business Engineer | FourWeekMBA
Disclaimer: This analysis is for educational and strategic understanding purposes only. All data points are sourced from public funding databases, company announcements, and industry reports as of August 2025. Not financial advice.
Want to analyze AI industry metrics and funding trends? Visit [BusinessEngineer.ai](https://businessengineer.ai) for AI-powered business intelligence tools.
The post AI Industry Evolution: The $300B Funding Explosion (2020-2025) appeared first on FourWeekMBA.
August 23, 2025
The Physics Constraints of AI
 Why We Can’t Build Fast Enough
The AI revolution faces constraints that no amount of money can immediately solve. These aren’t economic or technological limitations—they’re the hard physical realities of atoms, electrons, and thermodynamics.
Power generation represents the ultimate bottleneck. Data centers already consume 1-2% of global electricity. AI could push this to 10% by 2030. But you can’t simply build power plants overnight. A nuclear reactor takes 10-15 years from planning to operation. Even natural gas plants require 3-5 years. Solar and wind, while faster to deploy, can’t provide the baseline power that 24/7 AI training demands. The grid itself becomes a constraint—transmission lines take decades to approve and build.
The chip manufacturing bottleneck is even more severe. TSMC operates at maximum capacity for advanced nodes. Adding new capacity takes 2-3 years and tens of billions in investment. But the real constraint is ASML’s extreme ultraviolet (EUV) lithography machines—only 40-50 are produced annually, each costing $200 million and requiring 6 months to install. There are only enough EUV machines in existence to equip perhaps 20 advanced fabs globally. You could have infinite money and still couldn’t buy more machines than ASML can produce.
Cooling presents an underappreciated crisis. Current air cooling is reaching physical limits. Liquid cooling requires complete data center redesigns. Immersion cooling, while theoretically superior, lacks the supply chain to scale rapidly. The next generation of AI chips might generate more heat than we can physically remove from data centers using current technology.
The rare earth element constraint looms as China’s ace in the hole. China controls close to 70% of rare earth production and 90% of processing. These elements are essential for everything from GPUs to power electronics. China has already weaponized this advantage, restricting exports of gallium, germanium, and antimony. The West’s attempts to develop alternative supplies will take a decade minimum.
But perhaps the most fundamental constraint is human expertise. You can’t train an EUV technician in a coding bootcamp. Semiconductor process engineers require decades of experience. The knowledge to operate advanced fabs exists in perhaps 10,000 minds globally, mostly in Taiwan and South Korea. Money can’t buy expertise that doesn’t exist.
The interconnection of these constraints creates cascading bottlenecks. You can’t add data center capacity without power. You can’t increase power without grid upgrades. You can’t upgrade grids without rare earth elements. You can’t process rare earths without Chinese cooperation. Every solution creates new problems, and every workaround faces its own constraints.

The post The Physics Constraints of AI appeared first on FourWeekMBA.


