
Gennaro Cuofano's Blog, page 117
February 10, 2022
What Is Hybrid Working? Hybrid Working In A Nutshell

Hybrid working is a flexible working model not dissimilar to teleworking or remote working. The practice allows employees to combine working from home with working in an office or other workplace. Hybrid working is a location-flexible work schedule where employees combine working from one with working in an office or other place of employment.
Understanding hybrid workingHybrid working became more popular in the wake of the COVID-19 pandemic as companies scrambled to limit exposure to the virus. However, this form of working will continue and become more diverse even after the worst effects of the pandemic have subsided.
Corporations such as Facebook, Twitter, and Microsoft are rewriting the rule book on the future of work. Hybrid working, they contend, allows for versatile working styles, configurations, and needs. What’s more, fixed workspaces will be substituted with mobile, more collaborative spaces as pandemic protocols remain in place. Density limits and physical distancing, for example, are making traditional workplaces untenable for businesses as twice the amount of space is now required for the same number of employees.
Hybrid working modelsAs the hybrid working model diversifies, four general models have emerged:
At-will modelWhere the employee chooses on or off-site working according to whatever suits them at the time. For instance, an employee may choose to come into the office to meet an important client or to find a spot to work in peace away from the demands of home.
Shift work modelIn the shift work model, employees work in shifts where they alternate between working from home and working morning or evening shifts in the traditional place of work. The shift work model tends to be less popular among employees for obvious reasons.
Split-week modelPerhaps the most common hybrid work model is the split-week approach. Here, an employee spends two or three days of the workweek at home and two or three days onsite. Which days the employee spends where usually depends on the department they work in. For example, the sales team may use the office on Monday and Thursday with marketing taking Tuesday, Wednesday, and Friday. This is not a perfect solution, but it does allow all employees to touch base or meet with their teams and have face-to-face interaction with colleagues and superiors.
Week-by-week modelThis model is similar to the split-week model except employees from various departments alternate between onsite and offsite work every week. This approach is used by companies with larger teams who all need to be in one space at the same time.
Limitations of hybrid workingDespite the obvious practicalities of the hybrid working model, inevitably it will be unsuitable for a percentage of employees.
Some report that having to maintain two workplaces is problematic. The practice is tedious and time-consuming and there is potential for employees to leave important items at one workplace while they transition to the other.
The constant change of workplace setting is also emotionally draining for some workers. They report not ever feeling settled, which causes an increase in stress levels and a decrease in productivity.
According to the employee engagement platform TINYpulse, over 80% of leaders reported that their employees were exhausted from hybrid work. This view was echoed by the workers themselves, who noted rather alarmingly that hybrid work was more emotionally draining than full-time work in an office.
Key takeaways:Hybrid working is a location-flexible work schedule where employees combine working from one with working in an office or other place of employment.Hybrid working models include the at-will model, shift work model, split-week model, and week-by-week model.Hybrid working is a practical approach, but like many broad initiatives, will not be suitable for every employee. Having to maintain two workspaces and be forced to constantly shift between them, some reported, was more emotionally draining than working full time in an office.Connected Frameworks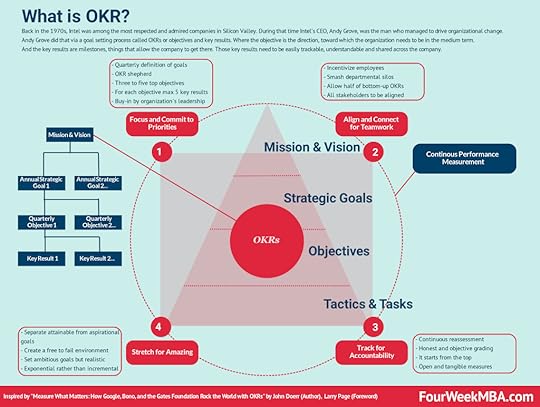 Andy Grove, helped Intel become among the most valuable companies by 1997. In his years at Intel, he conceived a management and goal-setting system, called OKR, standing for “objectives and key results.” Venture capitalist and early investor in Google, John Doerr, systematized in the book “Measure What Matters.”
 First proposed by accounting academic Robert Kaplan, the balanced scorecard is a management system that allows an organization to focus on big-picture strategic goals. The four perspectives of the balanced scorecard include financial, customer, business process, and organizational capacity. From there, according to the balanced scorecard, it’s possible to have a holistic view of the business.
 The theory was developed by psychologist Edwin Locke who also has a background in motivation and leadership research. Locke’s goal-setting theory of motivation provides a framework for setting effective and motivating goals. Locke was able to demonstrate that goal setting was linked to performance.
 A SMART goal is any goal with a carefully planned, concise, and trackable objective. To be such a goal needs to be specific, measurable, achievable, relevant, and time-based. Bringing structure and trackability to goal setting increases the chances goals will be achieved, and it helps align the organization around those goals.
 Businesses use backcasting to plan for a desired future by determining the steps required to achieve that future. Backcasting is the opposite of forecasting, where a business sets future goals and works toward them by maintaining the status quo.
 Moonshot thinking is an approach to innovation, and it can be applied to business or any other discipline where you target at least 10X goals. That shifts the mindset, and it empowers a team of people to look for unconventional solutions, thus starting from first principles, by leveraging on fast-paced experimentation.
Related Strategy Concepts: Go-To-Market Strategy, Marketing Strategy, Business Models, Tech Business Models, Jobs-To-Be Done, Design Thinking, Lean Startup Canvas, Value Chain, Value Proposition Canvas, Balanced Scorecard, Business Model Canvas, SWOT Analysis, Growth Hacking, Bundling, Unbundling, Bootstrapping, Venture Capital, Porter’s Five Forces, Porter’s Generic Strategies, Porter’s Five Forces, PESTEL Analysis, SWOT, Porter’s Diamond Model, Ansoff, Technology Adoption Curve, TOWS, SOAR, Balanced Scorecard, OKR, Agile Methodology, Value Proposition, VTDF Framework, BCG Matrix, GE McKinsey Matrix, Kotter’s 8-Step Change Model.
Main Guides:
Business ModelsBusiness StrategyMarketing StrategyBusiness Model InnovationPlatform Business ModelsNetwork Effects In A NutshellDigital Business ModelsThe post What Is Hybrid Working? Hybrid Working In A Nutshell appeared first on FourWeekMBA.


What Is Hot Desking? Hot Desking In A Nutshell

Employees who work under the hot desking system do not have assigned seating. Instead of having one desk or space to call their own, these employees use whatever space is available when they arrive at work. The practice is thought to be a derivate of hot racking, which describes the practice of sailors working on different shifts while sharing the same bunk. Hot desking, therefore, describes a workspace system where desks can be used by any employee at any time on an ad hoc basis.
Understanding hot deskingHot desking emerged in the 1990s and has seen renewed interest due to a shift toward remote work and pandemic-induced demand for more flexible work schedules. The approach is well suited to hybrid workplaces where employees have more freedom to decide where they work. Indeed, if employees are not in the office every day, there is no point in them having a permanently assigned desk.
Advantages and disadvantages of hot deskingHot desking has several important advantages and disadvantages for both the business and the employee. Let’s have a detailed look at these below.
AdvantagesCOVID-19 safety – hot desking allows the business to determine how many workstations it can accommodate based on social distancing guidelines. The practice also encourages the business to maintain an activity report so that cleaners know which desks need to be sanitized between shifts. Space utilization – permanent workstations are costlier to maintain since they require more space. Employees engaged in remote or hybrid working use less office space that the business can then use for some other purpose.Clutter reduction – with no employee assigned to a specific desk, there is less opportunity for the individual to clutter their desks with personal and other items. This creates a tidier, organized, and more productive space.DisadvantagesEmployee disruption – for employees who like routine and order, hot desking is likely to be disruptive since they may be forced to work in a different area each day.Loss of productivity – some employees, particularly if they are rostered later than others, also waste valuable work time searching for a suitable place to set up. These employees often find that productive spaces near windows or in a quiet corner of the office are always taken.Lack of communication – since employees never know where their colleagues are seated on any given day, communication can suffer. Newer employees who require assistance on a matter may find it difficult to source help as there is less chance they’ll be seated next to colleagues in the same department. A social media expert, for example, may find themselves seated next to an accountant. The lack of communication and predictable seating also makes it harder to call impromptu meetings or discuss important issues in a timely fashion.Key takeaways:Hot desking describes a workspace system where desks can be used by any employee at any time on an ad hoc basis.Hot desking emerged in the 1990s and has seen renewed interest due to a shift toward remote work and pandemic-induced demand for more flexible work schedules.Hot desking increases COVID-19 safety for businesses and leads to better space utilization and clutter reduction. However, it can be disruptive for employees who favor routine and can cause a reduction in productivity and communication.Connected FrameworksAndy Grove, helped Intel become among the most valuable companies by 1997. In his years at Intel, he conceived a management and goal-setting system, called OKR, standing for “objectives and key results.” Venture capitalist and early investor in Google, John Doerr, systematized in the book “Measure What Matters.” First proposed by accounting academic Robert Kaplan, the balanced scorecard is a management system that allows an organization to focus on big-picture strategic goals. The four perspectives of the balanced scorecard include financial, customer, business process, and organizational capacity. From there, according to the balanced scorecard, it’s possible to have a holistic view of the business.
 The theory was developed by psychologist Edwin Locke who also has a background in motivation and leadership research. Locke’s goal-setting theory of motivation provides a framework for setting effective and motivating goals. Locke was able to demonstrate that goal setting was linked to performance.
 A SMART goal is any goal with a carefully planned, concise, and trackable objective. To be such a goal needs to be specific, measurable, achievable, relevant, and time-based. Bringing structure and trackability to goal setting increases the chances goals will be achieved, and it helps align the organization around those goals.
 Businesses use backcasting to plan for a desired future by determining the steps required to achieve that future. Backcasting is the opposite of forecasting, where a business sets future goals and works toward them by maintaining the status quo.
 Moonshot thinking is an approach to innovation, and it can be applied to business or any other discipline where you target at least 10X goals. That shifts the mindset, and it empowers a team of people to look for unconventional solutions, thus starting from first principles, by leveraging on fast-paced experimentation.
Related Strategy Concepts: Go-To-Market Strategy, Marketing Strategy, Business Models, Tech Business Models, Jobs-To-Be Done, Design Thinking, Lean Startup Canvas, Value Chain, Value Proposition Canvas, Balanced Scorecard, Business Model Canvas, SWOT Analysis, Growth Hacking, Bundling, Unbundling, Bootstrapping, Venture Capital, Porter’s Five Forces, Porter’s Generic Strategies, Porter’s Five Forces, PESTEL Analysis, SWOT, Porter’s Diamond Model, Ansoff, Technology Adoption Curve, TOWS, SOAR, Balanced Scorecard, OKR, Agile Methodology, Value Proposition, VTDF Framework, BCG Matrix, GE McKinsey Matrix, Kotter’s 8-Step Change Model.
Main Guides:
Business ModelsBusiness StrategyMarketing StrategyBusiness Model InnovationPlatform Business ModelsNetwork Effects In A NutshellDigital Business ModelsThe post What Is Hot Desking? Hot Desking In A Nutshell appeared first on FourWeekMBA.
What Is The Easterlin Paradox? The Easterlin Paradox In A Nutshell
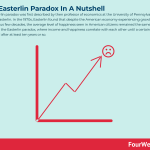

The Easterlin paradox was first described by then professor of economics at the University of Pennsylvania Richard Easterlin. In the 1970s, Easterlin found that despite the American economy experiencing growth over the previous few decades, the average level of happiness seen in American citizens remained the same. He called this the Easterlin paradox, where income and happiness correlate with each other until a certain point is reached after at least ten years or so. After this point, income and happiness levels are not significantly related. The Easterlin paradox states that happiness is positively correlated with income, but only to a certain extent.
Understanding the Easterlin paradoxIt is worth noting that it is the long-term trends in happiness and income that are unrelated. In the short term, the two factors normally go up and down together. For example, consider the sentiment that accompanies stock market crashes. Consumers tend to be sad in the immediate aftermath of a crash but become happier as the market starts to recover.
The Easterlin paradox has been hotly debated because of the inherent problems with defining happiness and the far-reaching implications for public policy. Indeed, if economic growth does little to enhance happiness beyond a certain point, should governments instead focus on measures of national happiness?
Easterlin paradox findingsIn a comparative study using data from the United States and 11 other countries, Easterlin reported the following findings:
Within countries, wealthier individuals reported a higher level of subjective wellbeing (SWB) than did poorer individuals.Across countries, there was no comparable difference in the SWB of countries deemed to be rich and countries deemed to be poor.Third, the results of a longitudinal study found that the economic development of a country did not increase the individual SWB of that countries’ citizens.From these findings, Easterlin made two conclusions:
On the micro-level, the income of an individual increases subjective well-being significantly.On the macro level, the national economic growth of a country expressed as per capita GDP does not necessarily increase subjective well-being.Interestingly, these conclusions were consistent across countries with different traditions, cultures, natural environments, economic environments, and political systems.
Criticisms of the Easterlin paradoxIn addition to subjective definitions of happiness and broader policy implications, there is much debate around the validity of the Easterlin paradox itself. Though beyond the scope of this article, Easterlin’s data collection and analysis techniques have been called into question.
Subsequent empirical studies found that SWB was much higher in rich countries than it was in poor countries. What’s more, there was also a significant correlation between per capita GNP and national wealth with the subjective well-being of a nation’s citizens.
Another study in 2006 by Veenhoven and Hagerty found that the SWB in developing nations such as India, South Korea, Philippines, South Africa, Brazil, and Nigeria had increased substantially over the previous 50 years. In releasing their data, the pair refuted Easterlin’s claim that economic growth did not add to the quality of life measures that increased happiness.
Further economic data from China also cast doubt on the Easterlin paradox. The data showed that Easterlin’s conclusion at the micro-level was supported. However, at the macro level, the data showed that stagnation in SWB among Chinese citizens was evident but not because of economic development per se.
In the case of China, the period of rapid growth caused many citizens to lift themselves out of poverty and become happier as a result. However, the fact that the period of growth occurred for so long meant the increase in happiness was offset by widening income inequality. These two effects canceled each other out and caused SWB to trail behind economic growth in the country – but not for the reasons Easterlin’s theory stipulates.
In response, Easterlin revised the theory and posited that a U-shaped pattern best illustrated the relationship between economic development and SWB. In the short term, SWB is positively correlated with a nation’s economic growth. In the long term, however, this growth has a limited effect on individual income. This revision, at least to some extent, made the Easterlin paradox more convincing to skeptics and arguably more relevant to countries undergoing similar economic growth.
Key takeaways:The Easterlin paradox states that happiness is positively correlated with income, but only to a certain extent. It was first described by then professor of economics at the University of Pennsylvania Richard Easterlin in 1974.The Easterlin paradox found that on the micro-level, the income of an individual increases subjective well-being significantly. On the macro level, the national economic growth of a country does not necessarily increase subjective well-being.The Easterlin paradox has attracted criticism for the data on which it is based. Subsequent studies found a strong correlation between economic growth and subjective well-being in developing countries. Data from a period of growth in China also found that the relationship between income and happiness was more nuanced than the Easterlin paradox accounts for.Main Guides:
Business ModelsBusiness StrategyBusiness DevelopmentDistribution ChannelsMarketing StrategyPlatform Business ModelsNetwork EffectsRelated Business Concepts As highlighted by German psychologist Gerd Gigerenzer in the paper “Heuristic Decision Making,” the term heuristic is of Greek origin, meaning “serving to find out or discover.” More precisely, a heuristic is a fast and accurate way to make decisions in the real world, which is driven by uncertainty.
 The recognition heuristic is a psychological model of judgment and decision making. It is part of a suite of simple and economical heuristics proposed by psychologists Daniel Goldstein and Gerd Gigerenzer. The recognition heuristic argues that inferences are made about an object based on whether it is recognized or not.
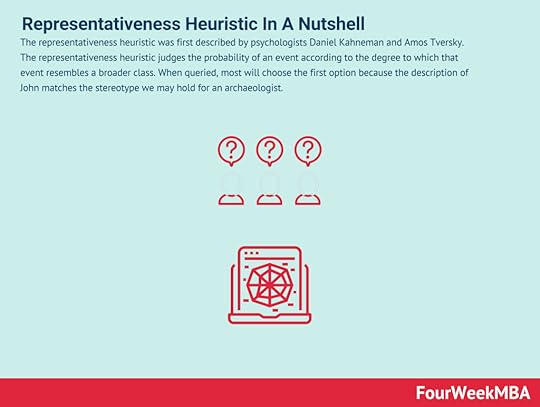 The representativeness heuristic was first described by psychologists Daniel Kahneman and Amos Tversky. The representativeness heuristic judges the probability of an event according to the degree to which that event resembles a broader class. When queried, most will choose the first option because the description of John matches the stereotype we may hold for an archaeologist.
 The take-the-best heuristic is a decision-making shortcut that helps an individual choose between several alternatives. The take-the-best (TTB) heuristic decides between two or more alternatives based on a single good attribute, otherwise known as a cue. In the process, less desirable attributes are ignored.
 The concept of cognitive biases was introduced and popularized by the work of Amos Tversky and Daniel Kahneman since 1972. Biases are seen as systematic errors and flaws that make humans deviate from the standards of rationality, thus making us inept at making good decisions under uncertainty.
 The bundling bias is a cognitive bias in e-commerce where a consumer tends not to use all of the products bought as a group, or bundle. Bundling occurs when individual products or services are sold together as a bundle. Common examples are tickets and experiences. The bundling bias dictates that consumers are less likely to use each item in the bundle. This means that the value of the bundle and indeed the value of each item in the bundle is decreased.
 The Barnum Effect is a cognitive bias where individuals believe that generic information – which applies to most people – is specifically tailored for themselves.
 Nudge theory argues positive reinforcement and indirect suggestion is an effective way to influence the behavior and decision making of individuals or groups. Nudge theory was an idea first popularized by behavioral economist Richard Thaler and political scientist Cass Sunstein. However, the pair based much of their theory on heuristic research conducted by psychologists Daniel Kahneman and Amos Tversky in the 1970s.
 The bullwhip effect describes the increasing fluctuations in inventory in response to changing consumer demand as one moves up the supply chain. Observing, analyzing, and understanding how the bullwhip effect influences the whole supply chain can unlock important insights into various parts of it.
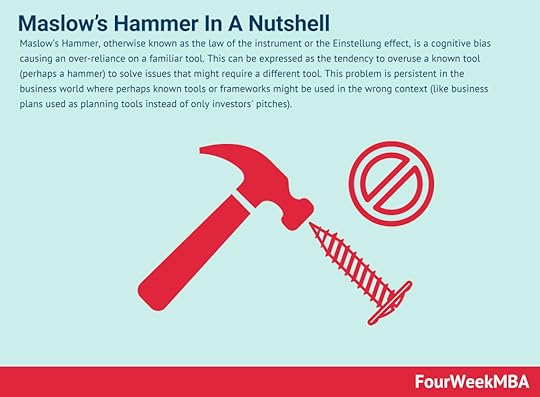 Maslow’s Hammer, otherwise known as the law of the instrument or the Einstellung effect, is a cognitive bias causing an over-reliance on a familiar tool. This can be expressed as the tendency to overuse a known tool (perhaps a hammer) to solve issues that might require a different tool. This problem is persistent in the business world where perhaps known tools or frameworks might be used in the wrong context (like business plans used as planning tools instead of only investors’ pitches).
The post What Is The Easterlin Paradox? The Easterlin Paradox In A Nutshell appeared first on FourWeekMBA.
What Is The Snowball Effect? The Snowball Effect In A Nutshell

The snowball effect is a metaphor that describes any action or event as it evolves from something unimportant to something larger and more significant. The metaphor is named after the analogy of a snowball as it rolls down a hill covered in snow. The snowball effect describes a scenario where one action or event results in many similar and more significant actions or events.
Understanding the snowball effectAs it rolls, the snowball picks up snow and increases in surface area as a result. The increase in surface area means it can absorb more snow and grow even larger. Perhaps most importantly, the snowball gathers momentum as it rolls down the slope and increases in size.
In business, it can be helpful to think of the snowball effect as past or current actions or events that will have significant benefits in the future.
The snowball effect in businessThe snowball effect metaphor has multiple applications in business. Below is a look at just a few of these applications.
EntrepreneurshipEntrepreneurs are well aware of the implications of the snowball effect – even if they do not associate those implications with the metaphor itself.
A startup founder understands that reaching critical mass is the most difficult part of the process. Once critical mass is reached, however, they know that the company is self-sustaining and profitable enough to grow by itself.
BloggingBlogging is another example of the snowball effect at work, particularly in what is now an ultra-competitive market.
Most content writers start blogs and may write hundreds of informative or entertaining posts before they see any appreciable traffic. The process of working to gain traction for a blog is characterized by frustration, uncertainty, and perseverance and requires a great deal of faith.
At some point, however, the blog will start to gather momentum. Perhaps a social media influencer or celebrity shares a post on social media. Perhaps an update to the algorithm that ranks Google search results increases visibility. Whatever the driver, note that the blog from this point will start to attract more and more traffic as it becomes increasingly well known.
MarketingWhile everyone loves instant results, it is important to understand that it takes time for marketing campaigns to either show promise or be destined for the trash. In other words, marketers should not abandon an idea before it has had a chance to prove itself.
According to the Online Marketing Institute, consumers need to hear an offer as many as thirteen times before the business can generate a qualified, sales-ready lead. This can be explained by a couple of psychological effects. The first is the exposure effect, which posits that consumers respond more favorably to marketing messages they’ve heard before. The second is the Baader-Meinhof phenomenon, which describes a situation where consumers are exposed to something and then begin to notice it everywhere.
Whatever the psychology behind marketing, the snowball effect reinforces the idea that marketing teams need to hit prospects with the same message repeatedly before they become a customer. Once this has been achieved and provided the product is high quality, word-of-mouth means the business may experience a rapid increase in sales momentum.
Key takeaways:The snowball effect describes a scenario where one action or event results in many similar and more significant actions or events.In business, it can be helpful to think of the snowball effect as past or current actions or events that will have significant benefits in the future.The snowball effect has multiple applications in business, including entrepreneurship, marketing, and blogging.Main Free Guides:
Business ModelsBusiness CompetitionBusiness StrategyBusiness DevelopmentDigital Business ModelsDistribution ChannelsMarketing StrategyPlatform Business ModelsRevenue ModelsTech Business ModelsBlockchain Business Models FrameworkConnected Business Concepts to Value InvestingCircle of Competence The circle of competence describes a person’s natural competence in an area that matches their skills and abilities. Beyond this imaginary circle are skills and abilities that a person is naturally less competent at. The concept was popularised by Warren Buffett, who argued that investors should only invest in companies they know and understand. However, the circle of competence applies to any topic and indeed any individual.What is a Moat
 Economic or market moats represent the long-term business defensibility. Or how long a business can retain its competitive advantage in the marketplace over the years. Warren Buffet who popularized the term “moat” referred to it as a share of mind, opposite to market share, as such it is the characteristic that all valuable brands have.Buffet Indicator
 The Buffet Indicator is a measure of the total value of all publicly-traded stocks in a country divided by that country’s GDP. It’s a measure and ratio to evaluate whether a market is undervalued or overvalued. It’s one of Warren Buffet’s favorite measures as a warning that financial markets might be overvalued and riskier.Warren Buffet Companies
 Warren Buffett is an American investor, business tycoon, and philanthropist. Known as the “Oracle of Omaha”, Buffett is best known for his strict adherence to value investing and frugality despite his immense wealth. He is among the wealthiest people in the world. Most of his wealth is tied up in Berkshire-Hathaway and its 65 subsidiaries.
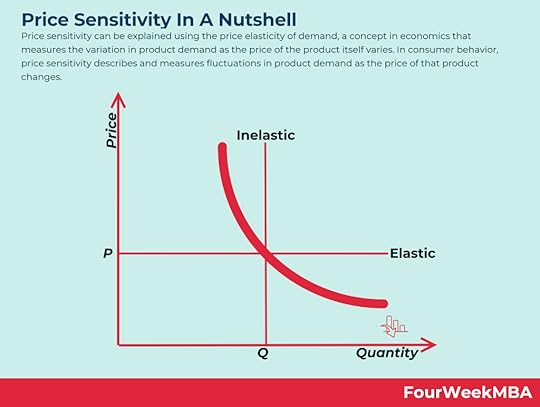 Price sensitivity can be explained using the price elasticity of demand, a concept in economics that measures the variation in product demand as the price of the product itself varies. In consumer behavior, price sensitivity describes and measures fluctuations in product demand as the price of that product changes.
 A price ceiling is a price control or limit on how high a price can be charged for a product, service, or commodity. Price ceilings are limits imposed on the price of a product, service, or commodity to protect consumers from prohibitively expensive items. These limits are usually imposed by the government but can also be set in the resale price maintenance (RPM) agreement between a product manufacturer and its distributors.
  Price elasticity measures the responsiveness of the quantity demanded or supplied of a good to a change in its price. It can be described as elastic, where consumers are responsive to price changes, or inelastic, where consumers are less responsive to price changes. Price elasticity, therefore, is a measure of how consumers react to the price of products and services.
 In Economics, Economies of Scale is a theory for which, as companies grow, they gain cost advantages. More precisely, companies manage to benefit from these cost advantages as they grow, due to increased efficiency in production. Thus, as companies scale and increase production, a subsequent decrease in the costs associated with it will help the organization scale further.
 In Economics, a Diseconomy of Scale happens when a company has grown so large that its costs per unit will start to increase. Thus, losing the benefits of scale. That can happen due to several factors arising as a company scales. From coordination issues to management inefficiencies and lack of proper communication flows.
 A network effect is a phenomenon in which as more people or users join a platform, the more the value of the service offered by the platform improves for those joining afterward.
 In a negative network effect as the network grows in usage or scale, the value of the platform might shrink. In platform business models network effects help the platform become more valuable for the next user joining. In negative network effects (congestion or pollution) reduce the value of the platform for the next user joining.
  Creative destruction was first described by Austrian economist Joseph Schumpeter in 1942, who suggested that capital was never stationary and constantly evolving. To describe this process, Schumpeter defined creative destruction as the “process of industrial mutation that incessantly revolutionizes the economic structure from within, incessantly destroying the old one, incessantly creating a new one.” Therefore, creative destruction is the replacing of long-standing practices or procedures with more innovative, disruptive practices in capitalist markets.
The post What Is The Snowball Effect? The Snowball Effect In A Nutshell appeared first on FourWeekMBA.
Cultural Models: Definition, Examples, And Frameworks
In the context of an organization, cultural models are frameworks that define, shape, and influence corporate culture. Cultural models also provide some structure to a corporate culture that tends to be fluid and vulnerable to change. Once upon a time, most businesses utilized a hierarchical culture where various levels of management oversaw subordinates below them. Today, however, there exists a greater diversity in models as leaders realize the top-down approach is outdated in many industries and that success can be found elsewhere.
Competing Values Framework The competing values framework was created by Robert Quinn and John Rohrbaugh, emerging from research into the major characteristics of effective organizations. The competing values framework is a tool used to understand and characterize organizational behaviors and beliefs and how they contribute to success.
The Competing Values Framework was developed in 1983 by Robert Quinn and John Rohrbaugh. The pair found that successful companies needed to balance two factors:
Focus – some companies were effective when they maintained a competitive external position, while others were better suited to focusing on internal processes, andStability – some companies were also more efficient when they displayed flexibility, while others were successful because they favored control and stability.From these two factors, Quinn and Rohrbaugh argued there were four ideal types of organization with each having a unique set of behaviors:
Hierarchy – inward-looking, ordered, and controlled companies with a focus on structure. Their rigidity makes them less responsive to situations and market demands.Clan – also inward-looking but able to respond to change with teamwork, collaboration, and a shared, almost familial environment.Adhocracy – outward-looking companies that are flexible and responsive innovators and risk-takers. Unsurprisingly, they tend to be entrepreneurial and driven.Market – outward-looking companies that are customer-oriented, competitive, less nurturing, and cognizant of their position in the market.Denison organizational culture modelThe Denison organizational culture model is a relatively recent model that was based on the Competing Values Framework. It describes four key traits (and twelve associated management techniques) that help an organization develop a robust and effective culture. These include:
Mission – does the company know where it is heading?Involvement – are employees engaged with their work and in alignment?Adaptability – is the company able to respond to the market, customers, and other external factors?Consistency – can the company leverage its values, processes, and systems?The model measures behaviors that are driven by the beliefs and assumptions of each trait to help the business clarify its culture.
Hall’s iceberg modelHall’s iceberg model was developed in 1976 by American anthropologist and cross-cultural researcher Edward T. Hall.
Hall likened corporate culture to an iceberg. He posited that some aspects of culture were:
Visible (above the waterline) – such as vision, mission, strategy, external presentation, and policies.Invisible (below the waterline) – such as values, norms, relationships, unwritten rules, status, and fundamental employee needs such as safety and belonging.Companies use Hall’s cultural model to shape their culture by addressing the invisible aspects as these constitute the values and thought patterns that ultimately drive behavior.
McKinsey 7s framework McKinsey’s Seven Degrees of Freedom for Growth is a strategy tool. Developed by partners at McKinsey and Company, the tool helps businesses understand which opportunities will contribute to expansion, and therefore it helps to prioritize those initiatives.
The McKinsey 7s framework was developed by Tom Peters and Robert Waterman while they were involved with McKinsey as consultants in the 1970s.
Peters and Waterman describe a corporate culture in terms of six elements that are classified as either:
Hard elements – strategy, structure, and systems, orSoft elements – staff, skills, and shared values.Each of these six elements is interdependent and each must be balanced for the company to succeed. To that end, the McKinsey 7s framework has a core focus on change management and its ability to positively or negatively reshape corporate culture.
Hofstede model Hofstede’s cultural dimensions theory was developed by Dutch social psychologist Geert Hofstede in 1980. Hofstede’s cultural dimensions theory is a framework for cross-cultural communication. To create his theory, Hofstede analyzed the results of a global survey of IBM employees to determine the dimensions in which different cultures vary. Between 1967 and 1973, approximately 117,000 employees across 50 countries were asked about workplace values and leadership and how they were influenced by culture.
The Hofstede model was developed by culture expert Geert Hofstede in the 1980s to serve as a framework for cross-cultural communication. Over six years, he analyzed the results of IBM employee surveys to determine how the culture of society impacted their values and by extension, workplaces.
Hofstede’s work has been used by consultants in international business, psychology, and communication. The model does not provide a concrete plan of action. Instead, it is used by businesses to conceptualize their ideal corporate culture and understand the various societal and cultural factors that are present. This makes it ideal for new companies who need to establish a corporate culture or develop a cultural manifesto.
Key takeaways:In the context of an organization, cultural models are frameworks that define, shape, and influence corporate culture. Cultural models are frameworks that provide some structure to a corporate culture that tends to be fluid and vulnerable to change.Cultural models include the Competing Values Framework, a common cultural model that inspired the relatively recent Denison model.Other models include Hall’s iceberg model, the McKinsey 7s framework, and the Hofstede model which is based on research into the impact of culture on employee values, societies, and workplaces.Main Free Guides:
Business ModelsBusiness StrategyBusiness DevelopmentDigital Business ModelsDistribution ChannelsMarketing StrategyPlatform Business ModelsTech Business ModelThe post Cultural Models: Definition, Examples, And Frameworks appeared first on FourWeekMBA.
What Is The OSKAR Coaching Model? The OSKAR Coaching Model In A Nutshell

The OSKAR coaching model was developed in the early 2000s by organizational theorists and authors Paul Z. Jackson and Mark McKergow. The OSKAR coaching model is a solution-driven method used for managerial coaching in the workplace. In their book titled The Solutions Focus: Making Coaching and Change Simple, the pair layout a framework to help coaches implement training sessions that are focused on solutions and not on problems.
Understanding the OSKAR coaching modelCoaching is a vital skill for leaders and managers in the workplace. When used in combination with positive feedback and reinforcement, it can foster behavioral change in subordinates that benefits themselves and the company as a whole.
The OSKAR model is one of many solution-based frameworks available for organizations. It is not as popular as the GROW model, but it is a useful alternative that is easily implemented and simple to understand. The focus of the OSKAR approach is to help the coachee move from their current state to a desired future state with more emphasis on behaviors than actions.
The five components of the OSKAR modelThe OSKAR model is an acronym of five stages. Let’s take a general look at each below:
Outcome (O)What does the coachee want to achieve in the short, medium, or long term? What do they want to achieve in each session and how will the coachee know if each session has been beneficial?
To help provide clarity to this process, the coach should ask the coachee to imagine a desired or ideal future state in detail.
Scaling (S)On a scale of 0 to 10, the coachee then rates where they are in relation to attaining that ideal state. Lower scores mean the individual is farther away, while higher scores mean the individual is closer. The coach should also rate the individual to increase objectivity.
Know-how (K)In the third state, the coach helps the coachee understand what skills and resources are required to achieve their stated goals.
Some reflective questions the coach could ask include:
What do you need to learn?Whose support do you need to secure?Are there new skills you need to invest in? Who can teach these skills?Affirm and action (A)In the fourth stage, the coach helps the coachee assess their current state and look for ways to improve it. While less than ideal, the individual who rated themselves as a 5 in the second step should be encouraged to think about the competencies that got them there.
Questions that encourage the coachee to open up and be kind to themselves include:
What are you doing now that is already working? What makes it effective?Which areas would you like to see change? How can this be accomplished?What is your first step to moving forward? Review (R)The review stage of the OSKAR process takes place in a separate session. This is because sufficient time should pass to allow the coachee to reflect on what has transpired and the progress that has been made.
The review stage should then recommend actions that form the basis of another cycle of the OSKAR model. In other words, the coachee returns to stage one and redefines their short, medium, and long-term goals.
Key takeaways:The OSKAR coaching model is a solution-driven method used for managerial coaching in the workplace.The OSKAR coaching model focuses on helping the coachee move from their current state to a desired future state with more emphasis on behaviors than actionsThe OSKAR coaching model consists of five stages: outcome, scaling, know-how, affirm and action, and review. The model is a cyclical approach to continuous improvement since observations from the review stage are then used to set goals in the initial outcome stage. Connected Coaching Frameworks Transformational leadership is a style of leadership that motivates, encourages, and inspires employees to contribute to company growth. Leadership expert James McGregor Burns first described the concept of transformational leadership in a 1978 book entitled Leadership. Although Burns’ research was focused on political leaders, the term is also applicable for businesses and organizational psychology.The theory was developed by psychologist Edwin Locke who also has a background in motivation and leadership research. Locke’s goal-setting theory of motivation provides a framework for setting effective and motivating goals. Locke was able to demonstrate that goal setting was linked to performance.
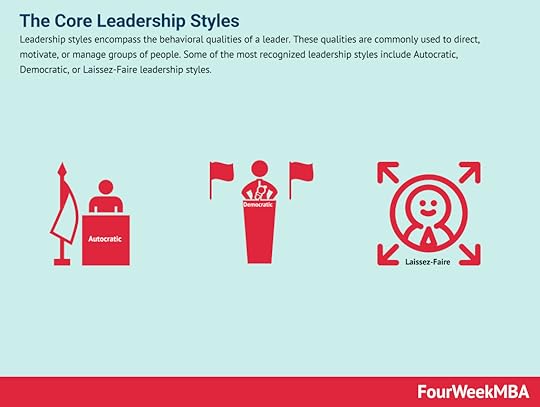 Leadership styles encompass the behavioral qualities of a leader. These qualities are commonly used to direct, motivate, or manage groups of people. Some of the most recognized leadership styles include Autocratic, Democratic, or Laissez-Faire leadership styles.
 The Value Disciplines Model was developed by authors Michael Treacy and Fred Wiersema. In their model, the authors use the term value discipline to represent any method a business may use to differentiate itself. The Value Disciplines Model argues that for a business to be viable, it must be successful in three key areas: customer intimacy, product leadership, and operational excellence.
 Tipping Point Leadership is a low-cost means of achieving a strategic shift in an organization by focusing on extremes. Here, the extremes may refer to small groups of people, acts, and activities that exert a disproportionate influence over business performance.
 Amazon fundamental principles that drove and drive the company are: Customer Obsession Ownership Invent and Simplify Are Right, A Lot Learn and Be Curious Hire and Develop the Best Insist on the Highest Standards Think Big Bias for Action Frugality Earn Trust Dive Deep Have Backbone; Disagree and Commit Deliver Results
 A personal mission statement clarifies what is important in life to an individual. A personal mission statement is a written statement of purpose that allows individuals to define their calling in life. It helps clarify goals, values, beliefs, or passions, communicate them, and better execute a personal growth strategy.
 The OGSM framework is a means of creating a well-structured and actionable marketing strategy. Fundamentally, the OGSM framework allows businesses to first define what they want to achieve and then determine how they will get there. To provide direction for marketing teams, the acronym of OGSM (objectives, goals, strategies, measures) should be followed in sequential order. Here is a look at each in more detail.A SMART goal is any goal with a carefully planned, concise, and trackable objective. To be such a goal needs to be specific, measurable, achievable, relevant, and time-based. Bringing structure and trackability to goal setting increases the chances goals will be achieved, and it helps align the organization around those goals.Moonshot thinking is an approach to innovation, and it can be applied to business or any other discipline where you target at least 10X goals. That shifts the mindset, and it empowers a team of people to look for unconventional solutions, thus starting from first principles, by leveraging on fast-paced experimentation.
Main Free Guides:
Business ModelsBusiness StrategyBusiness DevelopmentDigital Business ModelsDistribution ChannelsMarketing StrategyPlatform Business ModelsTech Business ModelThe post What Is The OSKAR Coaching Model? The OSKAR Coaching Model In A Nutshell appeared first on FourWeekMBA.
BCG Matrix Examples
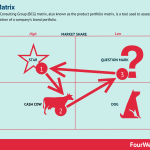

The Boston Consulting Group (BCG) matrix, also known as the product portfolio matrix, is a tool used to assess the strategic position of a company’s brand portfolio.
The BCG matrix was developed in 1968 by Boston Consulting Group founder Bruce Henderson in a short essay titled Perspectives. At its peak, Henderson’s model was used by approximately 50% of all Fortune 500 companies. Today, it is still one of the most popular product portfolio analysis methods and is a central component of many business school curriculums.
The approach places a firm’s products and/or services into a 2×2 matrix with four quadrants that measure market share and growth rate. Each quadrant is described as follows:
Question marks – high market growth/low market share products.Stars – high market growth/high market share products.Dogs – low market growth/low market share products, andCash cows – low market growth/high market share products.In this article, we’ll explain some BCG matrix examples from the likes of Coca-Cola and Apple.
Coca-ColaCoca-Cola is one of the most recognizable brands in the world, but its true global presence combined with shifting consumer preferences means it does not necessarily dominate every market it enters.
Question marks – as the soft drink industry undergoes rapid transformation toward healthier alternatives, the question mark quadrant is perhaps the most important to Coca-Cola. To that end, the company has invested a lot of money in low or no-calorie drinks such as tea and fruit juice. Diet-Coke is another product that falls within this quadrant. Despite attempts by Coca-Cola to market it as a healthier alternative, the product has not been able to gain significant traction.Stars – bottled water is one product that Coca-Cola has been able to move from the question mark quadrant to the stars quadrant. Brands such as Kinley, Dasani, and Glaceau Smartwater are significant players in the rapidly growing bottled water market. In the United States alone, sales of the latter two brands accounted for $1.911 billion in sales during 2021.Dogs – Coca-Cola Life is an example of one product that falls in the dogs quadrant. The product, which was a lower-calorie version of Coca-Cola, was made with the natural sweetener stevia. Critics derided the company for greenwashing, but, in any case, consumers showed little interest in the natural alternative.Cash cows – the Coca-Cola company has quite a few cash cow products, none more significant than Coca-Cola itself. Growth is limited since the product is sold in more than 200 countries and territories around the world. However, the drink remains immensely popular and a market leader despite a decline in global soft drink sales.AppleApple can boast a diverse product line that caters to a wide audience base. Let’s take a look at various Apple products in terms of the BCG matrix.
Question marks – while Apple has a dominant market share in many contexts, Apple TV and Apple AirPods face strong competition from both established brands and smaller companies. Apple TV in particular is a reasonable quality product that was simply ahead of its time. It may become more popular when consumers can appreciate the importance of the fact that it is part of the Apple ecosystem.Stars – the Apple iPhone is a star product that continues to deliver. With each update, the iPhone seems to set new innovative standards and smash previous sales records. The iPad and Smartwatch are not far behind.Dogs – the iPod could be considered an example of a dog product. While it only took the company five years to sell 100 million iPods, the longevity of the portable music player market was cut short by smartphone innovations and the rise of music streaming services.Cash cows – in terms of cash cows, the MacBook, iMac, and iPad enjoy relative dominance in their respective markets. These three products enjoy high brand equity, with devoted consumers more likely to purchase Apple products over comparable (and sometimes cheaper) alternatives.Key takeaways:The Boston Consulting Group (BCG) matrix, also known as the product portfolio matrix, is a tool used to assess the strategic position of a company’s brand portfolio. The matrix was developed in 1968 by Boston Consulting Group founder Bruce Henderson.Coca-Cola is one of the most recognizable brands in the world but is not immune from failed product launches or intense competition. As the soft drink industry wanes and consumers choose healthier alternatives, the question mark quadrant is perhaps the most relevant to the company’s long-term success.For Apple, products in the question mark quadrant may become more successful over time since they are integrated with other, more popular products. The iPhone, iPad, and Smartwatch are all products that enjoy tremendous market share, while the company’s laptop and desktop products are considered cash cows.Strategy frameworksAnsoff Matrix You can use the Ansoff Matrix as a strategic framework to understand what growth strategy is more suited based on the market context. Developed by mathematician and business manager Igor Ansoff, it assumes a growth strategy can be derived by whether the market is new or existing, and the product is new or existing.GE McKinsey Model
 The GE McKinsey Matrix was developed in the 1970s after General Electric asked its consultant McKinsey to develop a portfolio management model. This matrix is a strategy tool that provides guidance on how a corporation should prioritize its investments among its business units, leading to three possible scenarios: invest, protect, harvest, and divest.Porter’s Five Forces
 Porter’s Five Forces is a model that helps organizations to gain a better understanding of their industries and competition. Published for the first time by Professor Michael Porter in his book “Competitive Strategy” in the 1980s. The model breaks down industries and markets by analyzing them through five forcesMcKinsey 7-S Model
 The McKinsey 7-S Model was developed in the late 1970s by Robert Waterman and Thomas Peters, who were consultants at McKinsey & Company. Waterman and Peters created seven key internal elements that inform a business of how well positioned it is to achieve its goals, based on three hard elements and four soft elements.Porter’s Generic Strategies
 According to Michael Porter, a competitive advantage, in a given industry could be pursued in two key ways: low cost (cost leadership), or differentiation. A third generic strategy is focus. According to Porter a failure to do so would end up stuck in the middle scenario, where the company will not retain a long-term competitive advantage.
 According to Porter there are three core strategies for competitive positioning: cost leadership, differentiation and focus. Cost leadership is straightforward, as the player rolling this out will become the lost-cost producer in the industry.
 Porter’s Value Chain Model
 In his 1985 book Competitive Advantage, Porter explains that a value chain is a collection of processes that a company performs to create value for its consumers. As a result, he asserts that value chain analysis is directly linked to competitive advantage. Porter’s Value Chain Model is a strategic management tool developed by Harvard Business School professor Michael Porter. The tool analyses a company’s value chain – defined as the combination of processes that the company uses to make money.Porter’s Diamond Model
 Porter’s Diamond Model is a diamond-shaped framework that explains why specific industries in a nation become internationally competitive while those in other nations do not. The model was first published in Michael Porter’s 1990 book The Competitive Advantage of Nations. This framework looks at the firm strategy, structure/rivalry, factor conditions, demand conditions, related and supporting industries.SWOT Analysis
 A SWOT Analysis is a framework used for evaluating the business’s Strengths, Weaknesses, Opportunities, and Threats. It can aid in identifying the problematic areas of your business so that you can maximize your opportunities. It will also alert you to the challenges your organization might face in the future.PESTEL Analysis
 The PESTEL analysis is a framework that can help marketers assess whether macro-economic factors are affecting an organization. This is a critical step that helps organizations identify potential threats and weaknesses that can be used in other frameworks such as SWOT or to gain a broader and better understanding of the overall marketing environment.Blue Ocean Strategy
 A blue ocean is a strategy where the boundaries of existing markets are redefined, and new uncontested markets are created. At its core, there is value innovation, for which uncontested markets are created, where competition is made irrelevant. And the cost-value trade-off is broken. Thus, companies following a blue ocean strategy offer much more value at a lower cost for the end customers.
Read next:
Ansoff MatrixCompetitive AdvantagePorter’s Five ForcesAida ModelGrowth MatrixDigital Strategy MatrixSpeed-Reversibility MatrixOther resources:
Types Of Business ModelsBCG Business ModelPlatform Business ModelsDigital Business ModelsBusiness Strategy ExamplesGoogle Business ModelThe post BCG Matrix Examples appeared first on FourWeekMBA.
February 3, 2022
Digital Advertising Trends For 2022
Some key highlights from the latest financials of Google (Alphabet) and Facebook (Meta) also show some of the changes in the digital advertising landscape. This, in turn, is affecting millions of small businesses across the world:
The pandemic determined a mobile transition: while companies like Google and Facebook have been investing in mobile-first for years. In reality, it was the pandemic that accelerated the trend. For both Google and Facebook, mobile traffic is the only growth driver. An interesting note here: Google (thanks to its vertical integration) managed to monetize its increased adoption. Facebook, on the contrary, hasn’t, and this was definitely due to Apple’s privacy change. Supply chain of data: it’s crucial to understand how Google and Facebook are entirely different in terms of structure. Where Google is vertically integrated (Hardware/Android > Chrome/Play Store > Search Engine/Search Ads), Facebook primarily relies on its strong brands who benefit from stickiness (Facebook, Instagram, WhatsApp, Messenger, Oculus) . While this played out well for Facebook so far. As soon as Apple tied up the distribution pipeline, it threatened the whole business!Stalled user growth of Facebook: too much pressure with new social media platformsThe move into the Metaverse becomes a survival anchor for Facebook: where Google’s growth potential has not been affected so far (it might come in the future), Facebook’s growth has already been affected. Thus, the move to the Metaverse for Facebook is not just a strategic bet; it’s a survival anchor! This means Facebook has to rush into it! Blitzscale the adoption of VR devices, which might turn into enormous mistakes.Who might benefit? Let’s draw some key points:
Accelerating VR adoption for Facebook: Facebook has to push into VR (Oculus is a first step there). But the vision of Facebook of VR is way more pervading than any other company as its survival depends on that.VR/AR wars coming in 2022: all tech giants are rushing into VR with different philosophies. Apple believes in augmented reality, Google believes in mixed reality. Facebook wants to bring us into the Matrix. Therefore, we’ll see the first VR headsets probably in 2022 as the first exploration toward AR.Contextual advertising might win over targeted ads based on tracking: digital platforms that go back to contextual advertising rather than aggressive targeting might benefit in this phase (Reddit over Facebook).Rise of privacy first search engines and social media: companies whose business model has privacy built-in will keep their growth trajectory. Thus, search engines like DuckDuckGo might skyrocket, and social media platforms like MeWe might thrive.The post Digital Advertising Trends For 2022 appeared first on FourWeekMBA.
February 2, 2022
Google Financials 2021


Google’s parent company, Alphabet, released its end-of-year financials. Looking at its financials is important for various reasons and some of them are:
Assessing the digital advertising landscape. Understanding how Google’s advertising machine works at scale. How consumers’ behavior is shifting in this new digital landscape.Let’s dive into them.
Google’s profitability
Google’s profitability has slightly improved in 2021, thanks to the fact it managed to increase its revenue faster than it increased its operational costs, as traffic on its platforms increased substantially during 2020-2021. We’ll see in this in-depth analysis why that’s the case.
First of all, for the first time it its history, Google generated over $257 billion in revenues. And the company almost reached a two trillion market capitalization. For some context, when Google IPOed in 2004, it recorded almost a billion in revenues, and it was worth about $23 billion, as it popped at its IPO date to $85 per share (On February 2nd, 2022, a Google stock is worth $2,958.22).
At the time, in 2004, Google had just managed to scale its advertising machine comprised mainly of Google AdWords (today Google Ads) and Google AdSense. At the time the advertising machine was primarily based on Internet traffic from desktop devices. That was a completely different world.
As we’ll see throughout this analysis, today most traffic comes from mobile. And Google’s mobile ads platforms (Google AdMob) play a key role. So let’s dive a bit into the main financial segments of Google.
Google’s main segments in 2021
In 2021, the Google advertising machine-generated over $209 billion in revenues. This represented an over 42% growth, year over year! This is a massive improvement for a company worth almost two trillion. In a market landscape that is not anymore in favor of digital advertising. How did Google pull this off?
We’ll see this shortly. But for now, let’s emphasize a few key points.
Today the Google advertising machine is comprised of three main products:
Google Search/Properties: This represents the set of products that Google owns, from the search engines to all the other vertical platforms that the company operates (Google Discover, Google News, Google Travel, and more). In 2021, this segment generated over $148 billion!YouTube: This is of course one of the most successful business acquisitions ever done. It was acquired by Google for $1.65 billion in 2006. It’s important to notice that Google was able to integrate YouTube and scale it up. A feat that not every other company would have been able to achieve. At the time YouTube was getting sued for various copyright infringements (the platform is comprised of user-generated content, often posting copyrighted materials) that would have most probably bankrupted it if it had stayed a startup without Google’s backing. By 2021, YouTube has become an advertising machine generating over $28 billion (this doesn’t count the YouTube memberships, which are reported separately). And Google Network Members’ properties: this is the set of publishers that decide to opt into Google’s advertising network (either AdSense for desktop, or AdMob for in-app advertising). Here Google shows advertising on the network members’ properties, thus splitting the revenues with them. In 2021, Google’s network members generated over $31 billion of revenues.As we’ll see understanding the difference among these segments helps us understand how Google manages its cost structure for each segment.
What determines the growth of each segment?
Google’s search advertising has been driven by growth in search queries. In fact, since the pandemic hit, more and more users started to use Google’s products. This trend has continued. However, most of it was driven by mobile users’ growth. This is an important aspect, as it shows that Google’s main driver of growth is based on mobile traffic. This changes the way the company needs to prioritize its product developments efforts, its ad formats served to users, and also how it experiments. YouTube growth was driven primarily by improved ad formats. This means that Alphabet (as it’s evident to anyone going on YouTube) has ramped up the advertising operations on YouTube. In short, on YouTube now there are way more ads than before. This “improved ad formats” is the result of YouTube’s extreme stickiness with users, which enables Alphabet to play with its ad formats. Google’s network members’ properties were primarily driven by AdMob. In short, the mobile advertising platform, powered up by Android devices through the Google Play store, was the main driver of revenue growth in 2021. This shows how Google has shifted also its focus on the mobile advertising platform.Let’s see how, a little bit more in detail, ad monetization changed for Google.

In 2021, two main factors determined the improvement in ad monetization by Google.
First, Google recorded an increase in paid clicks (driven by an increase in user adoption and search queries primarily on mobile devices).
Second, this also drove more paid clicks in AdMob through the Google Play store.
Third, as we saw Google is testing various ad formats (we can argue it’s showing more ads) both on Google’s products and YouTube, which slightly improved monetization.

Among the other revenues, instead, Google Cloud also recorded an important growth thanks to the Google Cloud Platform.
Let’s look now at the other side, the cost structure.
Google’s cost structure
When it comes to Google its cost structure is pretty straightforward. In order to keep its operations profitable, it needs to be able to generate traffic at much lower costs, than it can monetize it. In 2021, Google traffic acquisition costs (the spending needed to run the servers, for its main products, and the deals in place to enable the distribution for its main products) were over $45 billion.
In respect to advertising revenues, its traffic acquisition costs were 22% of its advertising revenues in 2020. In 2021, instead, the traffic acquisition costs decreased to 21.7% compared to its revenues. This might seem a little difference. Yet, Google managed to lower its traffic acquisition costs, nonetheless its much wider users’ adoption.
This shows that a lot of that adoption was organic, and based on strong deals the company has in place.
The other cost of revenues instead was mainly driven by improved content acquisition costs and costs in data centers.

In terms of profitability, it’s interesting to notice, how, at a wider scale, Google Services has huge margins. That’s because as we saw in the previous paragraph, Google managed to improve monetization for users, it saw mobile users’ growth, while it managed to lower its traffic acquisition costs!
This combination led to an improved marginality.
However, it’s also interesting to notice how the Google Advertising machine is the only one running at positive margins.
Where instead, both the Google Cloud platform and the other Google Bets run at negative margins. Important to distinguish here.
The Google Cloud platform is critical for the future success of the Google AI platform.
When it comes to the other bets those instead are breakthroughs that Alphabet is pursuing with a long-term perspective. Those are money-losing bets for now but might turn into something interesting in the coming decade.
Key highlightsGoogle’s Alphabet has become a two trillion-dollar company in 2021. Back in the early 2000s, the company had started to build its advertising machine. This journey culminated in 2004 when the company had managed to put together the various pieces (Google AdWords and Google AdSense) of its advertising machine, thus scaling up its revenues on top of a growing search platform. Indeed, in 2004 Google generated almost a billion dollars in revenues, and it was worth about $23 billion as it IPOed. In 2021, the company passed the $257 billion mark! Among the biggest drivers of its revenues were the increased adoptions from users as the pandemic hit. This trend continues across 2020-2021. The increased search query traffic was primarily due to mobile users. Therefore, Google had to push more experimentations through its mobile platforms. YouTube, driven by mobile traffic growth saw also an important growth. Alphabet here pushed through more ad formats, and more advertising to monetize it further. Thus, taking advantage of the increased mobile traffic as a consequence of the pandemic. The above led to increased profitability, given the ability of Alphabet to reduce/or keep its costs stable as traffic increased. And yet its ability to keep monetizing the traffic through increased ad spending, but also by serving more ads on its platforms. Google ads platform remains the strongest segment of the company, with massive profitability. Google has negative margins on its Cloud Platform and its further bets. However, both play a critical role in the future (Google Cloud Platform in the next five years, while the other bets in the coming ten-fifteen years).The post Google Financials 2021 appeared first on FourWeekMBA.
February 1, 2022
What is The SFA matrix? SFA Matrix In A Nutshell
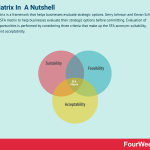

The SFA matrix is a framework that helps businesses evaluate strategic options. Gerry Johnson and Kevan Scholes created the SFA matrix to help businesses evaluate their strategic options before committing. Evaluation of strategic opportunities is performed by considering three criteria that make up the SFA acronym: suitability, feasibility, and acceptability.
Understanding the SFA matrixWith many strategic options to choose from, it can sometimes be hard for a business to determine which will produce the best outcome. Most choices have significant and far-reaching consequences for the business or the individual, so it’s important to choose wisely.
To help businesses evaluate their strategic options before committing, Gerry Johnson and Kevan Scholes created the SFA matrix. Evaluation of strategic opportunities is performed by considering three criteria that make up the SFA acronym.
SuitabilityThe most important factor in a strategic decision. Will the strategy achieve what the business wants it to achieve? Does it address key opportunities and threats? Suitability encompasses a broad range of criteria such as environmental, market, and expectational suitability.
FeasibilityCan the business execute the strategy effectively? Can it be financed? Are the right skills or expertise in place? Can resources be obtained in adequate quantities? Is the structure of the organization a good fit for the strategic plan? Are there moral, ethical, or legal concerns?
AcceptabilityDoes the proposed strategy meet stakeholder expectations? In other words, is the level of financial or reputational risk acceptable? Do potential project outcomes justify the expense? What will be the impact on capital structure, and will any function of the individual, group, or department be altered significantly?
Use of the SFA matrix normally takes place at the end of strategic planning once a strategic analysis has been performed. As a result, complementary frameworks such as Five Forces, SWOT, PESTLE, and SOAR are ideal.
Evaluating strategic opportunities using the SFA matrixEvaluating opportunities involves scoring each of them against the three criteria listed above.
Here is the process in more detail:
Define key elements for each of the three criteria
Depending on the industry, each business should qualitatively define several key elements. A logging company, for example, will list environmental impact as a key suitability element and access to electricity as a key feasibility element.
Using a spreadsheet, list each element under its relevant criteria heading in a column on the left-hand side.
Weight each element according to importance. The logging company may assign a weight of 0.7 to low environmental impact and a weight of 0.3 for market demand. Ensure that the sum of all weights for each of suitability, feasibility, and acceptability adds up to 1.
Then, score every key element against each strategic opportunity using a scale of 1 to 10. For example, the logging company may assign the environmental impact of clear-cut logging (a strategy option) a score of 3. On the other hand, more environmentally friendly selective logging may be given an impact score of 8.
Multiply the weight of each element by the score assigned in step four. Selective logging is a low environmental impact strategy, so it would receive a score of 8 x 0.7 = 5.6. Then, add each score together. The strategy with the highest score is deemed the most suitable, but teams must avoid combining the best parts of multiple strategies into one.
Some extra guidance on evaluating suitabilityMany businesses will find the evaluation of feasibility and acceptability straightforward. However, evaluating suitability can be more problematic.
To make this process easier, it can be useful to consider suitability in terms of three factors.
Strategic logicSince the 1950s, strategic logic has been quantified by rational or economic assessments that compare potential strategies with a firm’s market position and core competencies. While not an exhaustive list, several methods are used to establish the logic behind a strategy:
Portfolio analysis – this provides clarity on how a potential strategy may help improve the mix or balance of activities in a company.Value system analysis – an analysis to determine how a potential strategy may improve value system performance. One example is a synergy assessment, which looks at how extra benefit can be derived by connecting activities outside the value system.Life cycle analysis – these analyses determine where an initiative is likely to be suitable for a specific product life cycle stage. It also considers the relative positional strength of a company in the market.Cultural fitThis measures the extent to which a strategy will be assimilated within the organization. Cultural fit is not the most important determiner of whether a strategy is accepted. Instead, such strategies must be able to shape and influence culture according to whether or not the company wants to introduce a new way of operating.
If the firm is not seeking to adopt a new paradigm, the best strategies are those that are the most easily assimilated. If, on the other hand, the firm is looking to implement a new culture, the SFA matrix can be used to formulate a strategy that will help employees adapt to the change.
Research evidenceResearch evidence clarifies the concrete relationship between strategy choice and organizational performance. This relationship has been studied extensively since the 1970s, with a landmark study of over 3,000 businesses by the Strategic Planning Institute (SPI) just one example.
Collectively, these studies have arrived at several important conclusions for a business assessing suitability in terms of diversification and performance:
Diversification is not always profitable and is difficult to achieve in practice. Above a certain threshold, profit potential is reduced by increasing complexity. Similarly, the benefits of synergy vis-à-vis diversification make sense on paper but are harder to achieve in the real world. This is particularly true of companies that attempt to diversify through acquisitions. The success of any diversification initiative relies on a set of circumstances unique to each company, such as market structure, company size, or the level of industry growth. It was also found that some initiatives are more successful when enacted over a longer period.Key takeaways:The SFA matrix enables businesses to evaluate and then select a strategic option from a range of choices. It was created by Gerry Johnson and Kevan Scholes.The SFA matrix considers three key criteria of strategy development: suitability, feasibility, and acceptability. Suitability may be the hardest of three criteria to assess accurately.The SFA matrix calculates weighted scores for predetermined elements the business deems important. Although the elements can be adapted depending on the industry, there must be standardization in scoring and in element identification itself.Main Free Guides:
Business ModelsBusiness StrategyBusiness DevelopmentDigital Business ModelsDistribution ChannelsMarketing StrategyPlatform Business ModelsTech Business ModelThe post What is The SFA matrix? SFA Matrix In A Nutshell appeared first on FourWeekMBA.


