
Jay L. Wile's Blog, page 14
March 2, 2020
No Other Explanation: Dinosaur DNA!

Cells In two different stages of mitosis. The dark areas represent DNA, which is most likely damaged but still at least partially arranged in chromosomes.
(image from paper being discussed)
Despite the overwhelming evidence, there are some who are skeptical that soft tissue can be found in dinosaur fossils. Even among those who think that there may be soft tissue in some dinosaur fossils, there are those who think that there is no way complex molecules like DNA could possibly be found in that tissue. Well, Dr. Mary Schweitzer and her colleagues have recently published a study that, as far as I am concerned, should put all doubts to rest. Yes, dinosaur fossils do contain soft tissue and original dinosaur biomolecules, including DNA.
The study involves a detailed investigation of fossils from duck-billed dinosaur (Hypacrosaurus stebingeri) nestlings that are supposed to be 75 million years old. The authors examined cartilage tissue under the microscope and found what were obviously cells. Of course, that’s nothing unusual. The Dinosaur Soft Tissue Research Institute has some really great examples of dinosaur cells and other delicate structures from dinosaur fossils. They also have evidence for RNA in the fossils (see here, here, and here).
What’s new (and in my mind definitive) about this study is that they applied two different DNA stains to the tissue. The stains are designed to bind only to DNA, and when you use two different stains and see them both bind to the same structures, you have doubly confirmed the presence of DNA. Of course, what they saw could be DNA stains binding to DNA that contaminated the fossil, right? Wrong! The image at the top of the post indicates why. If I ask anyone who has taken a good high school biology class what the red box is drawn around, he or she should be able to tell me.
When cells reproduce, they go through a process called mitosis. It progresses through different stages, each of which is recognizable by the arrangement of chromosomes. In the second stage, called metaphase, the chromosomes line up at the center of the cell so that half of them can be pulled to one side of the cell and half can be pulled to the other side. In any sample of reproducing cells treated with a DNA strain, metaphase shows up as dark lines across the center of the cell. That’s exactly what you see in the part of the image surrounded by the red box.
Now, by itself, that’s not a “smoking gun.” It’s possible that DNA just happened to contaminate the fossil in a way that looks like metaphase. However, look at the bottom center of the image. There are two white arrows pointing to two dark spots. Those dark spots are surrounded by overlapping circles. Once again, any student who took a good high-school biology course should be able to tell me what that is. It’s the final stage of mitosis, telophase. So what we have here are cells that died in two different stages of mitosis. The one in the red square died in metaphase, while the other died in telophase. The DNA stain shows up not only in the correct places in both stages, but also in the correct shape. In my mind, that confirmes there is real dinosaur DNA in the fossil.
Not surprisingly, the authors agree. To understand how they say it, please note that “condensed state” in DNA refers to the DNA being arranged in chromosomes:
Contamination is not a plausible explanation in this case, and to this date, the possible preservation of original proteins and DNA in deep time has not been convincingly eliminated with data. Although extensive research and sequencing is required to further understand DNA preservation in Mesozoic material, along with its chemical and molecular alterations, our data suggest the preserved nuclear material in Hypacrosaurus was in a condensed state at the time of the death of the organism, which may have contributed to its stability.
In other words, there is no way that contaminants could form chromosome-like structures of DNA right where they are supposed to be in cells that died in the process of going through mitosis! Please note that there is a lot more to the study, including the confirmation that the cells are real cartilage cells and that there are dinosaur protein structures right where they are supposed to be in the tissues. However, to me the DNA results are the most important.
Now please understand that the DNA is probably degraded, but it is not degraded beyond recognition, since the stain is able to bind to it. However, as the authors state, this is not expected. Based on many experiments and our knowledge of biochemistry:
A short temporal range is predicted for informative biomolecules (∼1 MA for proteins, and ∼100,000 years for DNA; with 700,000 years as the oldest genome report).
So their study indicates something is wrong with the prevailing wisdom. Of course, their explanation is that DNA obviously must be more stable than the evidence indicates. As a result, they hope that there is a previously unknown, unthoughtof, exotic chemical mechanism that can make DNA last 750 times longer than current biochemistry indicates.
However, I have a much simpler explanation. There is no new chemistry here. As the current data and our understanding of biochemistry indicate, DNA cannot last anywhere close to millions of years. Indeed, even at temperatures well below freezing, it would be completely unrecognizable in about 1.5 million years. The reason we can find DNA in dinosaur fossils is because they are only thousands of years old.


February 24, 2020
A Newly-Discovered Component of Blood!
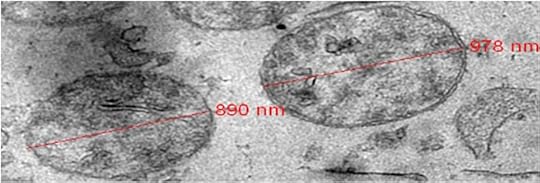
This transmission electron microscope image shows the structure of the newly-discovered blood component: functional mitochondria enclosed in vesicles.
(click for credit)
I have been teaching science for 34 years. I have been writing science textbooks for 27 years. I can’t tell you how many times I have written about blood and its components. Indeed, I am writing a 7th-grade textbook right now (Science in the Atomic Age), and it has a couple of sections on the properties and characteristics of human blood. As usual, I discuss the cellular components of blood (red blood cells, white blood cells, and blood platelets) as well as the chemical components of blood (blood clotting factors, water, electrolytes, various proteins, etc.). I honestly thought we understood blood pretty well. However, God’s creation is so complex and intricate, it still surprises us. In a recently-published paper, scientists have found that blood contains something no one ever noticed before, and it is neither cellular nor chemical. It is something in between!
To understand what was found, you need to know that cells in fungi, plants, animals, and people contain small structures that are responsible for burning chemicals from your food and packaging the resulting energy into small units that the cells can use. Those structures are called mitochondria. While most of a cell’s DNA is held in the nucleus of the cell, there is some DNA found in the mitochondria. Not surprisingly, it is called mitochondrial DNA (mtDNA) to distinguish it from the DNA found in the nucleus, which is called nuclear DNA (nDNA).
I had learned quite some time ago that there was a lot more mtDNA in blood than nDNA, but that always made sense to me. Red blood cells have neither, because they eject their nucleus and mitochondria when they mature. However, white blood cells have both. When someone extracts DNA from blood, he or she is getting the nuclear DNA from the white blood cells. Well, each cell has several mitochondria and only one nucleus, so the white blood cells will contribute more mtDNA than nDNA to blood. In addition, blood platelets have mitochondria but no nucleus, so they are contributing a lot of mtDNA and no nDNA.
Apparently, the magnitude of the difference bothered some researchers, so they decided to go looking for mitochondria that were in the blood but not part of a cell. They found them – lots of them! In fact, they found that the mitochondria were actually surrounded by a structure that encloses them. Here is how they describe it:
To sum up, we report here that blood contains intact cell‐free full‐length mitochondrial DNA in dense and biologically stable structures over 0.22 µm in diameter and that these structures have specific mitochondrial proteins, double membranes and a morphology resembling that of mitochondria. We further demonstrate that these structurally intact cell‐free mitochondria in the blood circulation are respiratory competent. We estimate that there are between 200,000 and 3.7 million cell‐free intact mitochondria per mL of plasma
In case you are having trouble understanding the jargon, “0.22 µm” means 0.22 millionths of a meter. This is important, as the smallest cellular components of blood are blood platelets, and they are 2-3 millionths of a meter in diameter. So these structures are ten times smaller than the smallest cellular components in the blood. “Morphology” refers to visible characteristics like size and shape, so these things look like mitochondria. “Repiratory competent” means they can still do what they do inside the cell; they can still make energy.
The transmission microscope image above comes from the study. Each oval is made by the structure that surrounds the mitochondria. The red lines show the longest dimension of the oval, and the numbers tell you how long it is. The “nm” unit means billionths of a meter, so these ovals are 0.890 and 0.978 µm across. That makes them bigger than the mitochondria, but still much smaller than blood platelets. The mitochondria, which are difficult to see, are the darker shapes contained inside the ovals.
What do these cell-free mitochondria do? Right now, we don’t know. Mitochondria have been seen being exchanged between cells, so it is possible that in addition to their main task of burning fuel for energy, they might be involved in communication between cells. It is even possible that they have some energy-related function that is independent of the cells from which they came. Figuring that out will be the focus of future research.
The main takeaway message to me is that even when we think we know pretty much everything there is to know about something in God’s creation, we probably don’t. His creation is vast and complex, and we will never know all that there is to know about it. That makes the scientist in me incredibly excited!
February 17, 2020
Our Best Computer is Positively PRIMITIVE Compared to the Human Brain

A small selection of the connections in the human brain (left) and the world’s most powerful supercomputer (right).
Image on left by the PIT Bioinformatics Group. Image on right by the OLCF at ORNL.
Creative commons licensing. Click for specifics.
I have been working on my new book, Science in the Atomic Age, which (Lord willing) will be published this summer. In the section where I cover the nervous system, I compare a mouse brain and a human brain to computers. It’s rather fascinating. Below, you will find a slightly-edited excerpt from that discussion. Please note that the students have already learned that neurons are cells found in nervous tissue and that the integumentary system is the system of organs that makes your skin:
The brain has three major divisions: the cerebrum (suh ree’ brum), the cerebellum (sehr’ uh bell’ uhm), and the brain stem. The cerebrum is in charge of most of the really complicated things that the brain does. For example, it receives signals from your eyes and interprets them so that you can see. It receives signals from your ears and interprets them so you can hear. It receives signals from all the nervous tissue in your integumentary system so that you can figure out what you are touching as well as things like whether you are too warm, too cold, or comfortable. It also helps you learn, and it stores your memories. All this takes a lot of work, so it requires a lot of neurons.
How many neurons? The average adult cerebrum contains about 20 billion neurons. That number doesn’t mean very much by itself, so by comparison, the average adult mouse cerebrum contains about 2.5 million neurons. So the human cerebrum contains about 10,000 times as many neurons as a mouse’s cerebrum. Of course, a mouse is much smaller than a person. By weight, a person is about 3,000 times as heavy as a mouse. At least part of the difference between a mouse’s cerebrum and a person’s cerebrum is due to that. But people are much more intelligent than mice, and the number of neurons in the cerebrum must also be related to that.
So let’s look at another comparison. In 2014, a study tried to compare the complexity of the brain to that of a computer. The study concluded that a personal computer could simulate the processes that are known to happen in a mouse’s cerebrum, but it wasn’t nearly as fast as a mouse’s cerebrum. The personal computer ran those processes about 9,000 times slower than the mouse’s cerebrum. In addition, remember that neurons need energy to stay alive and do their job, while computers need energy (in the form of electricity) to do their job. The personal computer simulating a mouse’s cerebrum was not only a lot slower than the mouse’s cerebrum, but it also consumed 40,000 times more power! In other words, a personal computer is very slow and inefficient compared to the cerebrum of a mouse.
So what about a human cerebrum? How does it compare to a computer? Right now, there is no computer in the world that could even attempt to simulate what we know goes on in a human cerebrum. The world’s most powerful computer is the Summit supercomputer, which is pictured above on the right. It has a million times the computing power of the best personal computers, but it is still ten times too weak to simulate what we know goes on in the human cerebrum. The study I have been talking about indicates that even if a computer capable of simulating a human cerebrum gets built, it will require 42 million times the power that the average human cerebrum requires. So our very best computers are primitive compared to the human brain!
Now before we continue this discussion, I need to make two points. The first one is obvious. Since our very best computers can’t come close to simulating what we know happens in a human cerebrum, it is rather obvious that the human cerebrum is very well designed. It should be, since it was made by the ultimate designer, God. But let’s consider the mouse’s cerebrum. Even though we can simulate what we know happens in a mouse’s cerebrum with a good personal computer, the computer is still very slow and inefficient compared to the mouse’s brain. Once again, that’s because the ultimate Designer, God, makes better things than we can.
The second point is also very important. Did you notice how I kept saying that computers can “simulate what we know goes on in a” cerebrum. The “what we know goes on” is very, very important. We don’t know everything that goes on in a cerebrum, and even if we did, we probably wouldn’t understand it. We know a lot about brains, but most scientists who study the brain will tell you that there is probably a lot more that we don’t know! So even though a personal computer can slowly and inefficiently simulate what we know goes on in a mouse’s cerebrum, it can’t “think” like a mouse. That would take a level of understanding that we haven’t come anywhere close to achieving. In the same way, even if there comes a time when a supercomputer can slowly and inefficiently simulate what we know goes on in a human cerebrum, it will not be able to think like a human, because we don’t understand anywhere close to what we would need to understand in order to get that job done!
February 10, 2020
68% of the Universe May Not Exist!

The history of the universe, according to the standard model of cosmology (click for credit)
Unsuspecting students are often taught “facts” that are anything but actual facts. Consider, for example, what NASA says about the nature of the universe:
It turns out that roughly 68% of the universe is dark energy. Dark matter makes up about 27%. The rest – everything on Earth, everything ever observed with all of our instruments, all normal matter – adds up to less than 5% of the universe. Come to think of it, maybe it shouldn’t be called “normal” matter at all, since it is such a small fraction of the universe.
What is this thing called “dark energy” that supposedly makes up more than half of the universe? NASA honestly says that no one has any idea. However, NASA assures students that we know that 68% of the universe is made up of it.
Of course, what NASA (and most astrophysicists) neglect to tell students is that the entire existence of dark energy, including its amount in the universe, is based on a myriad of assumptions, some of which are almost certainly not true. Nevertheless, they assure students that they know dark energy exists and that most of the universe is made up of it. The cold, hard truth, however, is that everything we know about dark energy is based on models, and those models are built on assumptions. If the assumptions are wrong, the models could be wrong, and if the models are wrong, the whole idea of dark energy could be wrong.
This issue was brought front and center with the recent publication of a paper that challenges one of the assumptions that is instrumental in the conclusion that dark energy exists. If the results of this paper are confirmed, dark energy will be thrown into the same trash bin as phlogiston, luminiferous ether, and the impossibility of quasicrystals.
To understand the research, you must first understand how we measure distances in the universe. Because the earth travels around the sun, it sees the universe from different perspectives. If you look at several stars at one time of the year, for example, and then look at them six months later, you will see that their relative positions are slightly different. This is called stellar parallax, and it is caused by the fact that you are looking at those stars from a different position than you were six months ago. Using some basic geometric arguments, you can use the observed change in relative positions to measure how far the stars are from the earth. This is a very reliable method for measuring the distance to a star, but the farther the star is from us, the harder it is to see its relative position change. The best telescope we have for this method can measure distances to about 3,000 light years from earth. That is all.
Of course, the universe is much bigger than that, so we have to find some other way to measure longer distances. Within 3,000 light years of earth, there are some stars whose brightness varies on a periodic basis. We can measure the distance to them using parallax, and we can then use that distance to convert the brightness that we see to the actual brightness of the star (the brightness we would see if we were right next to the star). Based on many such observations, there is a class of variable stars, called Cepheids, whose actual brightness is dependent on the frequency with which they vary. Assuming that relationship holds throughout the universe, we can look at Cepheids that are farther than 3,000 light years from earth and measure their period to get their actual brightness. We can use that actual brightness and the brightness that we see to determine how far away they are. Assuming the actual brightness we calculate is correct, the distance we determine is once again based solely on geometry.
Cepheids are called “standard candles,” because we think we can determine how bright they actually are and the use that brightness to determine how far away they are. The problem is that it gets harder to see Cepheids the farther you look from earth. As a result, we use different standard candles, type 1A supernovae, to measure very large distances. We assume that we can use them because where type 1A supernovae and Cepheids overlap, we seem to be able to predict the actual brightness of the supernovae correctly.
What does this have to do with dark energy? When we observe distant stars, we assume that the light that is coming from them is old, since the light had to travel from the star to get to us. If the star is 1,000 light years away, we assume the light is 1,000 years old. If the star is 1 million light years away, we assume the light is 1 million years old. Well…when we look at supernovae that are very far (billions of light years) away, they seem to be traveling more slowly than the stars that are “only” millions of light years away. Assuming the distance is also a measure of the time when the light left the star, we conclude that the universe was expanding more slowly billions of years ago than it was millions of years ago. In other words, the expansion of the universe is speeding up over time.
This doesn’t make sense if gravity is controlling the expansion of the universe, because gravity should be attracting all matter, which would slow down the expansion. Thus, the concept of dark energy was born. Dark energy is the mysterious “stuff” of the universe that pushes things apart. This mysterious stuff is stronger than gravity (at least over the whole of the universe), and that “explains” why the expansion of the universe is speeding up. The 68% comes from forcing the concept of dark energy into the standard cosmological model (the big bang) and then seeing how much is necessary to make the model consistent with the observed data.
Well…here’s the problem. The study I linked earlier has uncovered some data that indicate we have been calculating the brightness of type 1A supernovae wrongly. When the authors of the study use that data to “correct” those standard candles, they find that there is no need to assume the universe’s expansion is speeding up. In fact, they state that what they have found
…would inevitably cause a serious systematic bias with look-back time. Notably, taken at face values, most of the Hubble residual used in the discovery of the dark energy appears to be affected by the luminosity evolution.
In other words, their conclusion that type 1A supernovae brightness has been calculated incorrectly causes a systematic problem with determining how far away the supernovae are, which causes a problem with measuring the speed of the universe’s expansion. If what they have discovered is taken into account, there is no need to assume that the universe’s expansion is speeding up, and therefore there is no need for dark energy to exist.
Of course, using type 1A supernovae as standard candles is only one of a myriad of assumptions necessary to conclude that 68% of the universe is made of dark energy. Indeed, even the idea that light which comes from a billion light years away is a billion years old is based on an assumption. It assumes that the universe is pretty much the same everywhere, and we are fairly certain that’s not true. Nevertheless, unsuspecting students are constantly being told that 68% of the universe is dark energy, and they are not given the slightest inkling that there could possibly be anything wrong with that number. That’s the problem we have with science education these days. The scientific dogma of the day is preached as fact, even when it is based on a long list of faulty assumptions.
Now please understand that I am not saying dark energy doesn’t exist, even though I am very skeptical that it does. This one study cannot determine that. Indeed, there are already those who think the study itself is flawed. My point is simply that the very existence of this study demonstrates that “68% of the universe is dark energy” is not a fact, and it therefore should not be taught as such. Certainly it should be taught, since it is the reigning dogma of the day. However, honest scientists should indicate that the concept is built on a long list of assumptions, some of which are questionable, to say the least!
February 3, 2020
The Inquisition Is Furious About Brazil!

The logo of the Intelligent Design Research Institute at Mackensie University in Brazil. (click for source)
Bill Nye says and writes a lot of ignorant things (see here, here, here, here, and here, for example). While it is hard to choose the most ignorant statement he has ever made, this one has to be in the top five:
Denial of evolution is unique to the United States.
I have already shown how that statement is 100% false, and anyone who even casually investigates the issue would know that it is false. However, as the links above show, investigation is definitely not one of Nye’s strong suits! I was reminded of his incredibly ignorant statement when I read this article, from the journal Science.
Like Bill Nye, the author of the article doesn’t seem to understand how to investigate an issue. Nevertheless, the article has some interesting content. It seems that the federal government in Brazil has appointed Dr. Benedito Guimarães Aguiar Neto to head an agency called CAPES, which oversees Brazil’s graduate study programs. This is noteworthy, because Dr. Neto was instrumental in forming an Intelligent Design Research Center at Mackenzie Presbyterian University in Brazil. Of course, this infuriates the Scientific Inquisition, because Intelligent Design has been officially declared as heresy by the High Priests of Science. To have someone who believes in heresy positioned in a powerful educational office is unthinkable! As the article tells us, one Brazilian biologist has said:
It is completely illogical to place someone who has promoted actions contrary to scientific consensus in a position to manage programs that are essentially of scientific training.
Of course, that very statement is incredibly anti-science, because almost all of the great scientific advancements in history come from the very act of questioning the scientific consensus. I would think that every institution of higher education should have many high-level officials who challenge the scientific consensus.
As I said, the author of the article doesn’t seem to be able to investigate an issue, since he calls Dr. Neto a “creationist.” I realize that the term is very broad, but there is no indication that Dr. Neto is a creationist. In fact, all he has stated is that Intelligent Design should be introduced in Brazil’s basic educational curriculum. I suspect that he is an advocate of intelligent design for that reason, but that doesn’t make him a creationist. Dr. David Berlinski is an advocate of Intelligent Design, and he doesn’t even believe in God. However, if you are a lazy writer, it is easier to falsely label a person than it is to actually investigate what that person believes.
In any event, I can’t help but see this as a step in the right direction. The progress of science depends on questioning the scientific consensus. Whether or not it was intentional, Brazil’s government decided to appoint someone who is skeptical of the consensus in a position of influence when it comes to science education. Not only does this further demonstrate that Bill Nye’s statement is breathtakingly ignorant, but it also gives us more indication that the biological sciences are slowly emerging from the quagmire of NeoDarwinism and getting ready to truly advance.
January 29, 2020
Famous Australian Atheist Politician Becomes a Christian

Former Governor General of Australia, Bill Hayden (click for credit)
I have always been amazed by the many different ways God calls His people to Him. For me, God used science to convince me that there had to be a Creator. From there, I came to realize that the Creator is the God of the Bible. For others, it’s specific people who are influential in their lives. For others, it’s a specific experience or a long list of experiences that add together to lead them home. To see what I mean, read some of the accounts I have written about atheists who became Christians.This account is of Bill Hayden, a famous politician in Australia. He worked in government for 35 years, ending his storied career as the Governor-General of Australia, the highest executive office in the land. His atheism became well known throughout Australia when he was sworn in to that post. Usually, the Governor-General swears an oath on the Bible, but Hayden ignored that tradition and simply gave an affirmation. In addition, by tradition, the Governor-General is also the Chief Scout of Australia. However, Hayden refused that position, since his atheism was incompatible with the Boy Scout Promise. Instead, he took the role of National Patron for the Australian Boy Scouts.
Why was Bill Hayden an atheist? In an interview, he gave several reasons. His father was an atheist, but his mother was a devout Catholic. He had some bad encounters with pastors and priests. He couldn’t believe some of what he called the “tall stories” in the Bible, such as Naoh’s Ark. However, the turning point in his life came when his five-year-old daughter was hit by a car and killed while crossing the street after Sunday School. A kind priest tried to help him find comfort in prayer, but he found no comfort there. That seems to be the moment he decided he was an atheist.
What called him back home to God? Once again, there were several factors. However, the biggest seemed to be a nun named Sister Angela Mary Doyle. She worked with him to pass what is now called Medicare, Australia’s socialized medicine program. In the interview, he said that when he was with her he thought:
I had been in the presence of a holy one, a holy person. I felt it was something that suffused my system. My chest felt heavily congested with the feeling that I have been lucky…that I had been with a particularly holy person.
That gave him something to which he could relate, and he eventually shed his atheism to follow Christ. Towards the end of the interview, he gives some sound advice to those who are having doubts about Christianity:
Understand your faith. Don’t let your faith be damaged by the failure of a few agents who never allowed their faith to guide them.
As a young man, he certainly didn’t understand the faith. The “tall stories” to which he refers are not hard to believe at all. In fact, they are easier to believe than the tall stories that one must believe in order to be an atheist. However, to see that, you must understand the Scriptures. When his daughter died, he didn’t understand his faith enough to see how it should have comforted him in his time of grief. In addition, we must all keep in mind that many individuals who claim to represent Christ do not actually follow Him. We should not use their actions to judge the faith that they claim to represent.
January 24, 2020
That Virus in China

People in China wearing surgical masks. Photo copyright shutterstock/testing.
If you haven’t been paying a lot of attention to the international news, you might not know that there is a serious virus spreading in China. As of yesterday at 3 PM Eastern, 640 people have been infected, and 17 have died. Most of the cases are in China, where the virus originated, but there have been four cases in Thailand, two in Vietnam, and one each in Japan, South Korea, Singapore, and the United States. While there is always a chance that the virus could produce a pandemic, officials in China seem to be doing all they can to keep that from happening.
Several cities have suspended bus and train service in an attempt to keep people the virus from spreading through travel. The city in which it originated (Wuhan) has been completely shut down. A colleague of mine says that her son is in that city, and all transportation has ceased. Businesses (even grocery stores) are not allowed to open. People must make do with the food they currently have until the government decides that it is safe for businesses to open again. Currently, they are hoping to allow businesses to open on Tuesday. The virus is very dangerous, but the Chinese government seems to be taking it seriously. Only time will tell if their efforts will be enough.
What is this virus? It is a strain of coronavirus, which causes respiratory infections. It usually gets spread from animal to human, but in some cases, it can be spread from human to human as well. This version of the virus seems to be one of those. Most coronavirus infections produce mild symptoms. In fact, nearly everyone has had a coronavirus infection at one time or another. However, the severity of the infection depends on the proteins that the virus carries. The SARS epidemic of 2003 was caused by a particularly virulent coronavirus, resulting in more than 770 deaths worldwide. The hope is that the spread of this coronavirus can be better contained.
Why did it just appear? When the cell of an organism is infected with two different viruses, a new virus, called a recombinant virus, can be produced, mixing characteristics from each. That seems to be what has happened here. According to a study that was just published, it looks like the virus is a combination of a bat coronavirus and another one that cannot be identified. The study looked at the way the proteins are coded, and the authors claim that the most likely animal that spread the virus is a snake. That would be odd, since coronaviruses are only known to infect mammals. However, Wuhan does have open markets where live snakes are sold, and since that’s where the virus originated, it could have come from a snake.
Regardless of what animal it came from, once this new virus (which is really just a combination of two old viruses) was produced, it then was transmitted to a person. Once again, that’s usually the way a coronavirus is spread to people, but this one has been confirmed to spread from human to human, which is why China is clamping down on travel. The virus can be spread through the air, through personal contact, or from touching a surface that has the virus on it and then touching your mouth, nose, or eyes before washing your hands. Because of this, many people in China are wearing masks like you see in the photo above (which was taken a long time ago), and they are washing their hands regularly. Currently, there is no cure for the viral infection. The best thing that can be done is to treat its symptoms (fever, cough, and breathing difficulties) so that the body’s immune system has time to conquer it.
We should pray that the Chinese government is taking this situation as seriously as it seems to be, so that a deadly epidemic is averted. Also, we should pray for the people in the cities that are on lockdown. Not only are they the ones most at risk for the infection, but their lives have also been severely disrupted. Some may even have to deal with hunger or thirst caused by the precautions that are being taken.
January 20, 2020
A Dirty Childhood Can Lead to a Healthy Life

A happy child plays in a muddy river (photo copyright Shutterstock/Christin Lola)
One of the proposed explanations for the rise in allergies seen in the industrialized world is the hygiene hypothesis. It argues that many children who live in industrialized nations are raised in an environment that is just too clean. Because of this, they are not exposed to infectious and foreign agents that properly “train” their immune system. In addition, they miss out on some of the good bacteria and fungi that would take up residence in their body and support their immune system. As a result, the natural development of the immune system is stunted, and the body doesn’t know how to properly respond to certain assaults.
While there is a lot of good indirect evidence to support the hypothesis, the only controlled studies that support it have been done on mice. Of course, it is hard to do a controlled study on people, because you would have to get two similar groups of people and force them to live in different environments (one clean and one dirty) for a long period of time, and that’s just not practical. However, I recently came across a study which comes close to doing that, and the results strongly support the hygiene hypothesis.
The authors cleverly made use of an artificial separation of people that occurred more than 70 years ago. At the end of World War II, Finland had to give up some of its land to Russia, creating a new border between the two countries. Over time, the people who lived on either side of the border developed very different lifestyles. The Russian side of the border stayed largely agrarian, while the Finnish side became more urban. Since these two populations started out very similar but ended up very different, the authors decided to compare their susceptibility to allergies, and the results were rather astonishing.
In 2003, the authors randomly selected 98 Finnish children and 82 Russian children who were 7-10 years of age. They took skin samples and nose mucus samples, and they asked the parents to report on the childrens’ susceptibility to certain allergies. They also measured the sensitivity to certain allergens by looking at chemical levels in their blood. They then did a follow-up study of the same children roughly 10 years later. The results remained consistent between the initial and follow-up studies: The Finnish children were three to ten times more likely than the Russian children to have allergic reactions like asthma, hay fever, eczema, and a runny nose.
When the authors examined the skin and nose mucus samples, they found that the Russian children had a lot more bacteria in their skin and mucus than the Finnish children. In addition, the diversity of bacterial species was much greater in the Russian children. So the children who had more bacteria and lots of different species of bacteria living in and on their bodies were less likely to have allergies!
The authors specifically note that the largest disparities between the two groups were in bacterial species from the genus Acinetobacter. As the authors state:
Our results also suggest that high abundance and diversity of Acinetobacter might contribute to the low allergy prevalence in Russia. Implications of early‐life exposure to Acinetobacter should be further investigated.
In other words, the authors think that at least part of the reason that the Finnish children had more allergies is that they weren’t exposed to enough Acinetobacter. Where do these bacteria live? In dirt and water. So based on the results of this study, children who grow up doing things like the child in the picture at the top of the post are less likely to develop allergies later in life!
As a creationist, this doesn’t surprise me at all. God created us to interact with His creation, and when we try to isolate ourselves from it, we suffer.
January 13, 2020
How Can a Planet Orbit Two Stars?

An artist’s interpretation of the planet TOI 1338b, which orbits a binary star system. The planet is on the left. The two stars are the two white spheres. (NASA image)
If you haven’t seen it, there is a viral story about a high school student, Wolf Cukier, who made a significant discovery. During a summer internship, he was looking through data that had already been flagged as coming from binary star systems. In these systems, two stars orbit one another. While this may sound unusual, most stars in the universe (as far as we can tell, anyway) are a part of a system in which two or more stars orbit one another. Solitary stars like our sun are the exception, not the rule.
In most binary star systems, one star is much brighter than the other. As a result, if earth’s orbit is aligned with the orbital paths of the two stars in a binary star system, when the dimmer star passes between earth and the brighter star, the light we get from that star system gets dimmer. This is called an eclipsing binary. The data that Wolf Cukier was studying had already been noted as representing eclipsing binaries, but Wolf noticed another periodic dimming in the light coming from a binary star system charmingly named “TOI 1338.” The dimming was weaker than the dimming seen from the eclipsing binary, but it was regular. It was determined that this weak dimming was the result of a planet coming between earth and the brighter star in the binary system. In other words, this young man had found a planet orbiting two stars! Such planets are rare, but not unheard of. There were seven such planets confirmed before this one, but this is the first one discovered using this particular telescope, which is called TESS.
If you can’t quite visualize what is going on here, NASA has made a helpful animation, which I have included below. As you can see from the animation, when the dimmer star in the system passes between earth and the brighter star, the amount of light earth receives from the system decreases a lot. When the planet comes between earth and the brighter star, it dims a little.
The student and several scientists have co-authored a paper that has been submitted for publication. Years ago, I had a high school student co-author a scientific paper with me because of a discovery she made under my supervision, and it was very exciting. I hope that their paper gets published as well!
The reason I am blogging about this is because a reader asked me to explain the physics behind the situation. How can a planet orbit two stars? There are two major reasons, and they are both illustrated in this image, which comes from the animation above.
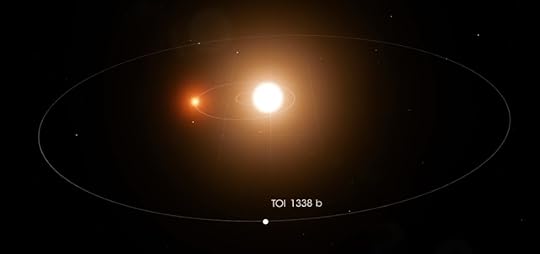
Notice first that the planet (labeled TOI 1338 b) is far from both stars. So the stars orbit one another inside the orbit of the planet. This makes the orbit more stable, because both stars are pulling on the planet in roughly the same direction. Each star is actually pulling the planet towards itself, but in each case, that’s still to the inside of the planet’s orbit. Thus, the two gravitational pulls don’t fight one another too much.
That brings me to the second major reason this planet’s orbit is stable. The two stars have very different masses. In the image, one of the stars is small, and the other is large. The large one has more than three times the mass of the small one. As a result, on average, the planet feels the stronger gravitational force pulling it to the large star. In other words, the large star tends to dominate the system. Also, notice the circles drawn with each star. Those are the paths the stars travel in the system. So even though both stars are moving in circles (technically, ellipses), the large star’s circle is small. That means the dominate gravitational pull is from the star that is not moving a lot. Once again, that makes the planet’s orbit more stable.
Now please understand that even though the orbit is stable, there are consequences to the fact that there are two stars orbiting each other inside. While the large star’s gravitational pull dominates the system, the small star still has a gravitational pull. When the small star and the planet are close together, the small star tugs on the planet more. When the small star and planet are farther from one another, the small star tugs less. This should cause the planet to deform, making it less spherical when it is close to the small star and more spherical when it is far from the small star.
Of course, if the planet were not far from the two stars, or if the two stars were more evenly matched when it comes to mass, it would be difficult to find a stable orbit for the planet.
January 9, 2020
Once Again, Don’t Get Your Science from Facebook!
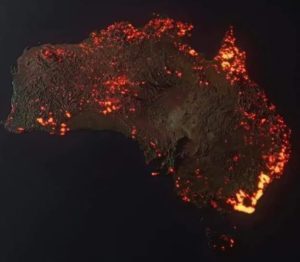
A visualization of the Australian fires that have happened recently (by Anthony Hearsey and Creative Imaging: click for more info)
I have made two posts so far cautioning people to be very skeptical of science-related Facebook posts (see here and here). In general, you should be skeptical of anything on any social media site, but science is easily skewed and misrepresented, especially when people are trying to show their own virtue by championing some cause.One case in point comes from the Australian bushfires that are wreaking havoc throughout the country. My Facebook feed recently showed me the image you see on the left. The person posting wanted to make me aware of how devastating the bushfires in Australia have become, so he posted this picture. While it does indicate an incredible level of devastation, it isn’t really true. There are two problems with the image. First, it looks like a satellite photo that is showing the fires burning right now, but it is not. It is an image that was developed on a computer, and it doesn’t show how Australia is burning right now or at any other time in the past. Each “flame” in the image represents a fire that burned sometime this season. In other words, it shows any region of Australia that had a fire this season, but it shows that region as on fire right now. In fact, many of the fires depicted on this image have been extinguished.
There is a bigger problem that is common with all visualizations of this kind. When you make an image like this, you need to add “fire” in the region where there is or was a fire. However, the image represents something very, very large. Suppose there was a fire that burned three square miles. That’s a big fire, but in this image, it would be represented by a red dot that is one millionth the size of the image. Thus, it wouldn’t show up. In order to make it show up, you need to make it bigger. However, that makes it look like more than three square miles were burned.
This issue is called “gridding.” When dealing with a large object, it must be partitioned into small sections by drawing a grid. If the sections in your grid are very large compared to the areas that you are depicting, the resulting depiction is deceptive. So, in fact, even considering all the fires that have happened so far this season (extinguished or not), they haven’t covered as much of Australia as the “flames” on this map.
Now don’t get me wrong. I am not saying that the fires in Australia are nothing to be worried about. They most certainly are devastating! They probably represent the worst bushfires in the past hundred or so years. That’s a bit hard to tell, because some of the most devastating fires in Australia occurred in the past, when news coverage wasn’t very good. We know, for example, that in 1851 widespread bushfires killed at least 12. In 1939, bushfires killed at least 71. While it does look like the current bushfires are burning a larger area than any of the previous ones, it is hard to say that with certainty. Regardless, the image above definitely overstates their severity.
The other thing that has to be said is that these bushfires are not the result of “climate change,” AKA global warming. In fact, we know that many of them are the result of arson. Since November, 24 people have been arrested in Australia for deliberately starting fires. In addition, another 183 are facing legal action because they did not obey fire-related laws, which might have led to even more fires. Thus, while it is popular to blame “climate change” AKA global warming for these fires, irresponsible and/or evil people are at least partially to blame. In addition, bushfires like these have been around long before carbon dioxide levels were rising in the atmosphere.
But wait a minute. These fires are spreading so quickly because there is a severe drought in Australia. Couldn’t the drought be caused by “climate change,” AKA global warming? Not based on the data we have right now. In 2017, a report on global droughts was published by the NOAA. The following graph, which depicts the percent of the globe that experienced drought each year, comes from that report:
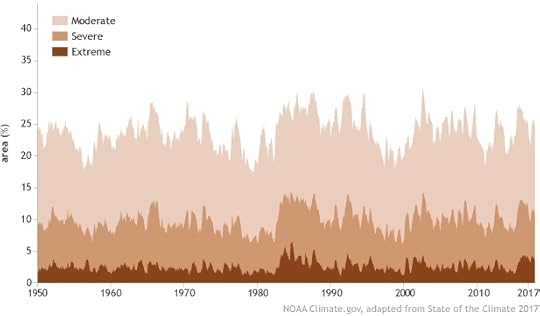
Notice that the percent of the globe that has been in any level of drought shows little (if any) trend since 1950. If “climate change,” AKA global warming were producing more droughts or increasing the severity of droughts, it should show up in a graph like this. It does not.
Once again, I am not downplaying the devastation that is occurring in Australia. In fact, I have donated to the relief effort, and if you feel led, you should as well.
Jay L. Wile's Blog

- Jay L. Wile's profile
- 31 followers

