
The Measurement and Display of Data Series
What are these series?
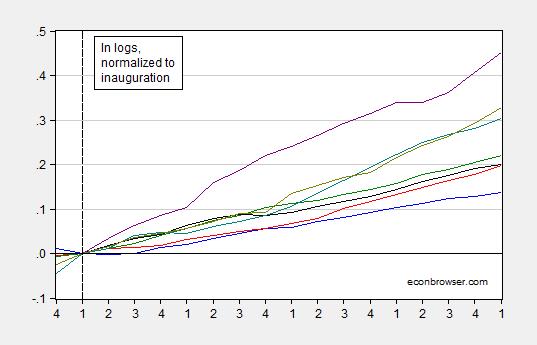
They are log GDP for the first terms of the most recent seven presidencies, SAAR, normalized to the quarter of inauguration.
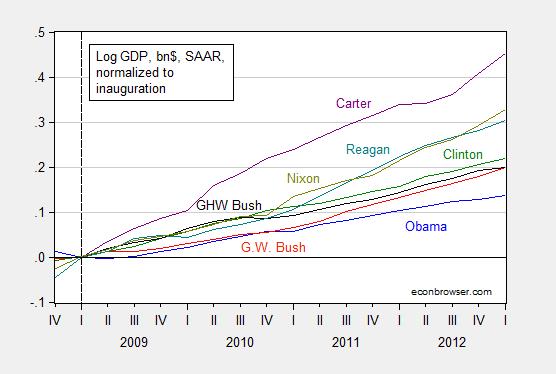
Figure 2: Nominal GDP, billions of $, SAAR, normalized to quarter of inauguration of first term for Obama (blue), GW Bush (red), Clinton (green), GHW Bush (black), Reagan (teal), Carter (purple), Nixon (chartreuse). Source: BEA (2014Q4 second release), and author’s calculations.
Some would object that using nominal GDP is misleading. In defense of reporting nominal magnitudes, reader Ironman writes:
It is our practice to always present nominal data because it is the data that doesn’t change as a result of inflation adjustments, which are always arbitrary in practice and are always in need of being updated, since almost all readers prefer that kind of information to be presented in terms of constant, current day dollars. Since we provide the relevant links to all original data sources, anyone who wants to confirm our numbers can get them and not wonder how they have been adjusted. Our readers are a pretty sharp bunch and are pretty capable of adjusting the nominal data to account for whatever measure of inflation they might like to consider, whether CPI-U, GDP deflator, etc.
Here for comparison is real GDP.
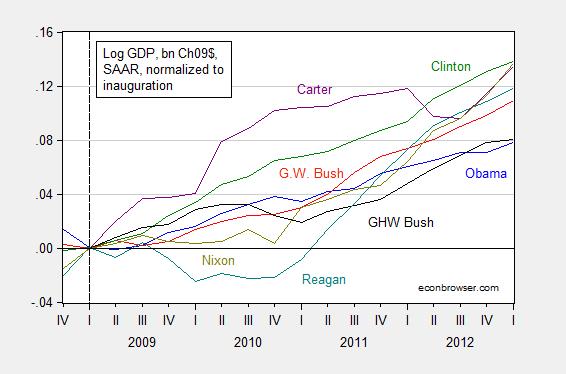
Figure 3: Real GDP, billions of Ch.2009$, SAAR, normalized to quarter of inauguration of first term for Obama (blue), GW Bush (red), Clinton (green), GHW Bush (black), Reagan (teal), Carter (purple), Nixon (chartreuse). Source: BEA (2014Q4 second release), and author’s calculations.
If you can do deflation, and the relevant graphing, in your head…you are a better man than I!
My view: deflation into real terms, even if not perfectly done, makes sense. The argument that deflators are revised over time, and hence makes deflation problematic is interesting, but in my mind not dispositive, given that nominal series are revised over time as well. For instance, after the third release of the 2014Q4 GDP figures next month, the series will be once again revised in the annual benchmark. Years thereafter, the real and nominal series will be revised again, as more data becomes available. So, unless the question pertains to nominal magnitudes instead of real (or one believes the deflators to be particularly problematic), it makes sense to report the variables in…real terms.
Here’s the real GDP series, for the entire presidential terms.
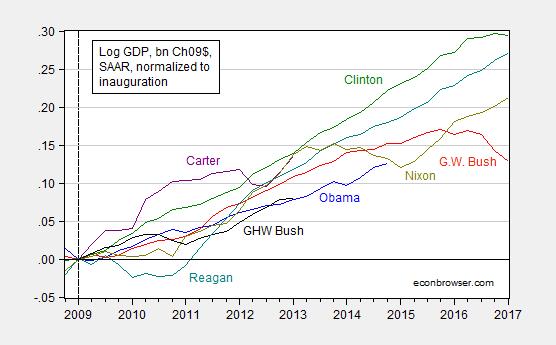
Figure 4: Real GDP, billions of Ch.2009$, SAAR, normalized to quarter of inauguration of first term for Obama (blue), GW Bush (red), Clinton (green), GHW Bush (black), Reagan (teal), Carter (purple), Nixon (chartreuse). Source: BEA (2014Q4 second release), and author’s calculations.


Menzie David Chinn's Blog


