Want a REST API to play with?
Are you just starting out with REST APIs, or curious what they look like, and want one that’s easy to play with? Have a go at this tutorial I’ve just written for the Google Maps Engine API: Putting your data on a map.
A few things make it easy to play with the API via the tutorial:
You can get started immediately. All you need are a project on the Google APIs Console and a Google Maps Engine account, both of which are freely available. The instructions are in the tutorial.
The API accepts requests via an online interface called the Google APIs Explorer. So, instead of having to send HTTP requests and parse responses via the command line or within a program, you can just use an online form. The APIs Explorer prompts you for the fields and parameters that are required for each API request. I’ve integrated the APIs Explorer into the tutorial, so each step of the tutorial offers a link to the appropriate form in the APIs Explorer.
If you use the APIs Explorer, you can skip the bit about OAuth and client IDs. Yaayyy for a touch of simplicity when first getting to know an API!
The tutorial includes the full HTTP URL and request body for each API request. For those into Java, there are Java code snippets and a downloadable sample app.
After performing each step of the tutorial, you get visual confirmation of results. So, you’ll follow instructions to send a request via the API, then you’ll look at your account in Google Maps Engine online to see what’s changed.
More about Google Maps Engine, its web interface, and the API
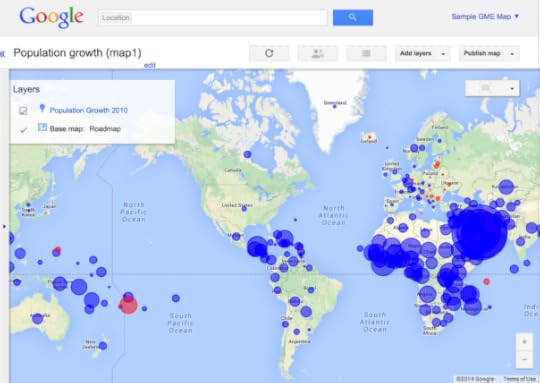
Google Maps Engine provides a means to store geographic data in the Cloud, and to superimpose that data on top of the Google base map. Geographic data can be vector or raster. In the tutorial, you’ll use vector data consisting of a set of geographic points (latitudes and longitudes) with the associated information that you want to represent on a map (in this case, population growth statistics).
Google Maps Engine offers a web UI (user interface) where you can upload data and customise your map. It also offers an API (application programming interface), so that you can upload and manipulate your data programmatically. This particular API is a REST API, which means that it accepts requests and sends responses via HTTP. The requests and responses use JSON format to represent and transfer data.
When following the steps in the tutorial, you’ll use the API to do something, such as upload a set of vector data, and then you’ll look at the UI to see the results.
What you’ll have achieved by the end of the tutorial
When you’ve finished the tutorial, you’ll have your very own interactive map in Google Maps Engine, looking like the screenshot below. The circles show population growth (blue circles) or decline (red circles) in countries around the world. The size of the circle represents the size of the change:
Let me know if you try it
I’d love to know how you get on with the tutorial, and what you think of the API. Here’s the link again: Tutorial 1: Putting your Data on a Map.


