The Nanten: Reached – a Recap and Some Stats
Written by the illustrious Jay Swanson
If you’ve been following along with my real time fantasy blog, Into the Nanten, you’ll know that Marceles has finally reached his destination. After 124 days in exile, and eight days of journal entries, he’s finally under the vast canopy of the Nanten jungle.
I thought I’d write a little recap of this first week for you as well as dive into some of the early statistics on the site.
The Recap
What we know: Marceles is a member of an elite order known as the Tetrarch – an order that has exiled him to the Nanten jungle for the crime of killing Lystra. A crime he seems to think was justified. Who Lystra is and why killing her was such a grave offense remains a mystery. What we do know is that he is following in the footsteps of the only other person he has ever known the Tetrarch to exile: Brin Salisir. And he hates Salisir.
He’s traveling with four companions: Balthandar, Bolton, Starlark, and Dionus. Already Starlark and Bolton are at odds with each other.

The final step in their journey was to cross the Blight Sea, a feat they accomplished by hiring a man called Tarsh to ferry them across on a rickety barge. He even regaled them with some lore of a goddess in the jungle. They didn’t trust him, and that mistrust has grown with the sense that he was hiding an ability with magic from them. But what he did give Marceles was a name: Bantish.
Whatever or whoever Bantish is remains a mystery as well, but Marceles seems convinced that it holds the key to their next clue.
Some Statistics
So a week in and we have some statistics to look over – because I love web stats. I’m going to give you my amateur interpretation of them, and then hopefully someone more knowledgeable can fill us in on what I misunderstood. We also have to figure out how to bridge gaps between Google’s statistics reporting and that of WordPress.com.
WordPress.com powered statistics:

These are generated by visits alone, of which WordPress claims we have had a total of 1,167 as of the writing of this entry. The boost on Wednesday (the 10th) makes sense, as the site didn’t go live until about 8PM (est) on Tuesday (the 9th). We have a steady decline, and then I promoted a post on Facebook – which explains a good chunk of the last two bars. But we can see there’s an “organic” upward trend going on again as we hit the 15th.
As of this moment WordPress.com claims that September 10 has been my biggest day so far by about 20 views.
I’m not going out on any limbs as to what the slump in the middle could mean. For one I didn’t really push the site beyond the normal outlets that get daily attention (Instagram, Twitter, and tumblr). The outside pushes came around both Wednesdays: Nimit’s post on the 10th sent somewhere over 100 of those visits, and Facebook would like to claim a lot of the visitors on the 16th and 17th.
But direct traffic is the biggest contender. Let’s take a look at Google.
Google Analytics:
There’s some juicy stuff here. First off I think it’s valuable to note that the shape of the graph is the same as the WordPress.com one, regardless of the nuanced differences. From there certain things don’t translate (WordPress views vs. Google sessions/users). I feel like we have to treat them separately.
First off Google claims there were more unique visitors this Wednesday (as of this post) than there were at the peak of last Wednesday. This is the inverse of what WordPress claims.
What got me the most excited was my bounce rate.
Bounce rates, if you’re unaware, are the percentage of users who left your site after only one pageview. In other words: they came, they saw, they bounced. My bounce rate is an astonishing 2.4%! And that’s skewed by the first Tuesday’s 16.67% – which is still impressive considering that for the entire day the site was just two pages declaring “Coming soon!” and “Featuring Artwork by Nimit Malavia.” Otherwise my bounce rate only rises above 1.5% once, and hits 0% three times.
In other words, practically everyone that visits Into the Nanten spends time on it and navigates around the site. I’ve never had a website that accomplished that. Ever. For contrast, jayswanson.me (this website)’s bounce rate is 58.6% – abysmal. But where is everyone coming from?
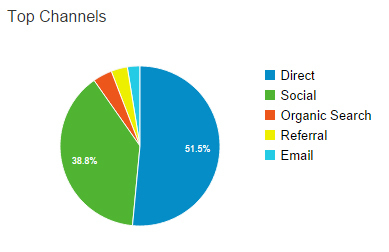
Google does tip its hat to social referrals, but direct traffic wins week one. This could be skewed by the fact that anyone coming from Instagram can’t click on a link in the caption, they’d have to type it in on their own. Odds are good that the social piece of the pie is significantly larger.
So far readers of Into the Nanten are also 74% male, but we’ll get into that later.
I’ve experimented with two ad campaigns which I’ll go into soon as well. Facebook’s seems to have been fairly effective, but expensive – where Goodreads has so far proven completely ineffective.
Do you have any insights into these statistics? It looks like a healthy start for a no-name blog by a no-name author to me, but I’m biased. What do you think?
The post The Nanten: Reached – a Recap and Some Stats appeared first on jayswanson.me.


