
Maybe We Can’t Just All Get Along…
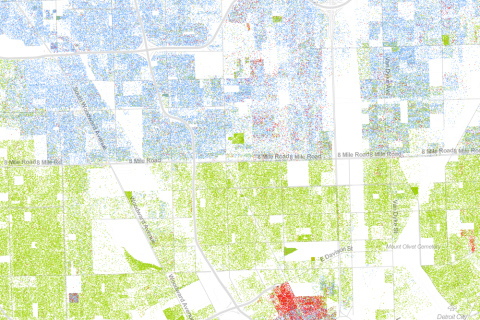
(Photo of Detroit’s 8-mile Road courtesy of Dustin Cable.)
A fascinating visualization of census data (Wired) shows us that we aren’t as integrated as we think we are. The article provides a look at 17 areas in the U.S. (and 3 nationwide) using colored dots to represent different ethnic distributions. The result? Largely homogenous groups of ethnicities. About the study:
The map, created by Dustin Cable at University of Virginia’s Weldon Cooper Center for Public Service, is stunningly comprehen...


No comments have been added yet.
From My Pen

News, announcements, and other information about my books and publishing company. I've also connected my regular blog (http://blog.jasonthibeault.com) here which includes lots of my thoughts on a vari
...more
- Jason Thibeault's profile
- 14 followers

