I've stopped using colored-region ("choropleth") maps. Should you?
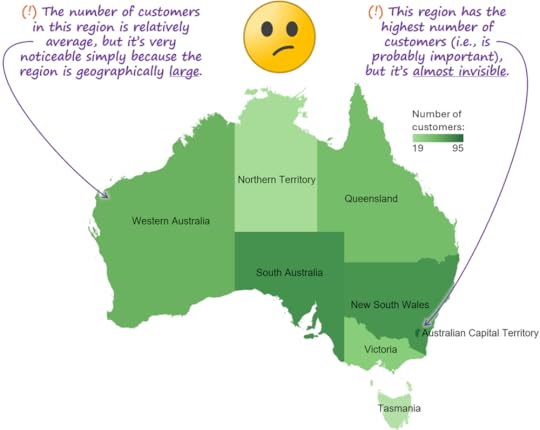
Probably the most common way to show values on a map is the "colored-region" or "choropleth" method. I'm not the first to notice, however, that this method presents some potentially serious perceptual risks (this was first pointed out to me by Stephen Few):
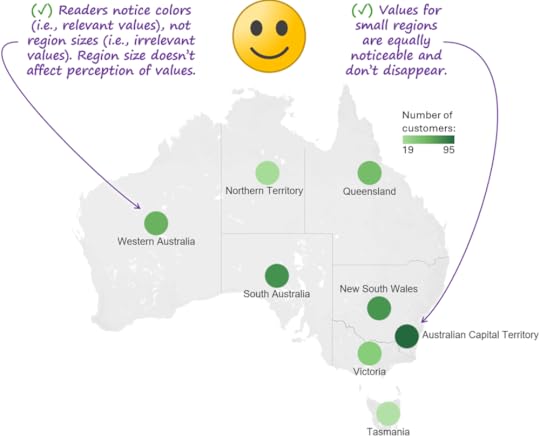
Other map types such as "colored dot" maps don't pose these same risks:
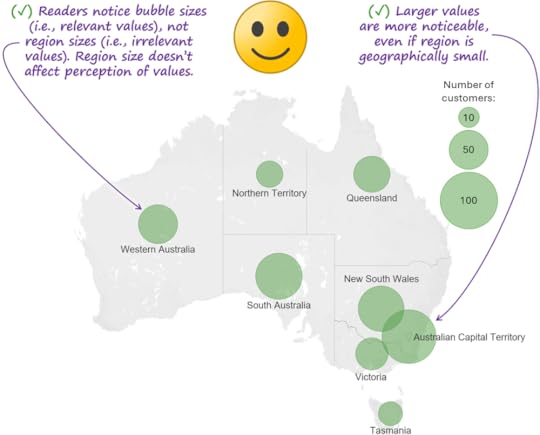
"Bubble maps" (a.k.a., "proportional symbol maps") also avoid the risks of choropleth maps:
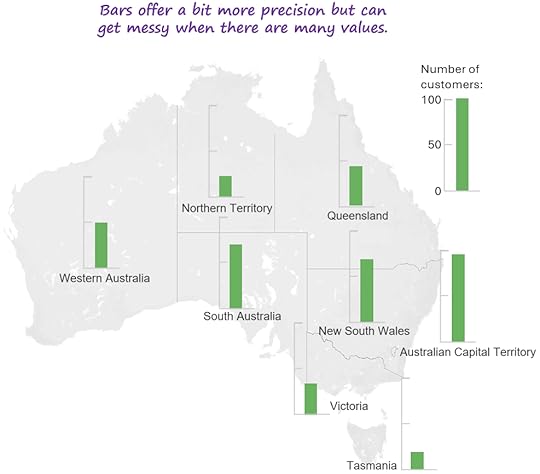
You could also use bars, which would actually allow values to be estimated a bit more precisely than colored dots or bubbles. The downsides of bars, however, (there are always downsides...) are that they can make it tougher to spot patterns (clusters, gaps, etc.) when there are a lot of values, and the chart can look visually busier:
When I posted these examples on LinkedIn, a few people said that choropleth maps are O.K. as long as the map is showing "ratio" values, such as "Inhabitants per square kilometer." Well, if you were to show those values for, say, the countries in East Asia, the values for regions like Singapore and Hong Kong would be almost invisible in a choropleth map, even though they would be some of the largest values in the whole map, so I'm not sure choropleth maps would be O.K. when showing these "ratio" types of values, either.
IMHO, the only time when it would be "safe" to use a choropleth map would be when all the regions being shown happen to have roughly the same size and shape. The issue is that, of course, that's almost never the case for any area of the world at any scale (Asian countries, South African provinces, Californian counties, etc.).
BTW…
European friends! I'll be in your continent of the woods next month, and the week of Sep23-27 just opened up for me. If you'd like me to deliver my Practical Charts and/or Practical Dashboards courses in person to your team or speak at your event during that week, contact me asap!