
Geography and the Shifting Ratios of Inequality – University, A levels and GCSEs in 2020
Why should the exam debacle of 2020 matter to Geographers? One answer is that Geography is likely to be especially affected by the rise in intake in universities that will now occur. This is because even a very small increase in people from less affluent backgrounds taking Geography at University will have a larger effect on this subject than any other in terms of university inequality statistics. More young people from poorer backgrounds will now be admitted in 2020 across the country. There may also be a knock-on effect in two years time when students with higher GCSE grades apply to university. First, a little background.
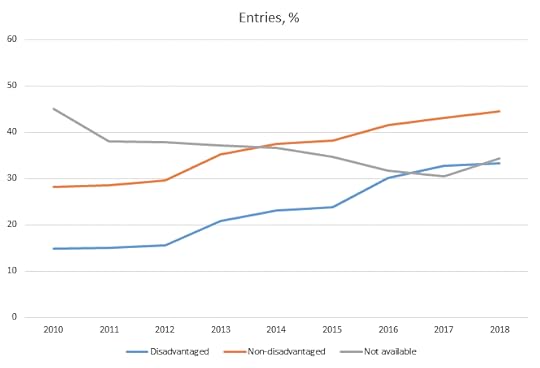
Entry into GCSE Geography study by Free School Meal Status
GCSE Geography Entry rates in England for students from advantaged and disadvantaged backgrounds (measured by proxy of who receives Free School Meals). Source and copyright: Royal Geographical Society (with IBG)
The graph above, kindly provided by Steve Brace and Catherine Souch of the Royal Geographical Society (RGS-IBG), shows that the gap in those choosing to take a GCSE in Geography in England from disadvantaged compared to advantaged backgrounds narrowed between 2015 and 2016 after Geography was included as a subject in what is known as the English Baccalaureate (EBacc) and schools were encouraged to increase the proportion of their pupils taking Geography. This came about largely because fewer children from disadvantaged backgrounds – defined here as qualifying for free school meals (FSM) – had traditionally taken Geography. However, we did not then see a narrowing in the social divides of who went on to take Geography at A level; and the social divide in who carried on to study Geography at University (which was already wide), widened further for the cohorts who took Geography more often at GCSE (up until the 2019 entry year).
The graph below is also drawn from work currently being undertaken by the RGS-IBG which shows both the expected and actual A-level uptake per FSM quintile. The data show the outcome once all other associated factors have been stripped away, with geography as a subject underperforming. This means, for instance, that although a black student living in the inner city may be much less likely to enrol in A-Levels anyway, if they enrol at all they are even less likely to enrol in geography. This obviously has implications for the longer term ‘pipeline’ when it comes to diversity in university cohorts. In the graph below the point labelled ‘Q5’ represents pupils from the fifth of schools with the income poorest students; about 2% of the pupils in such schools would be expected to take an A level in Geography, but the actual proportion is nearer to 1.5% or about 6 times fewer than from the best-off fifth of schools.
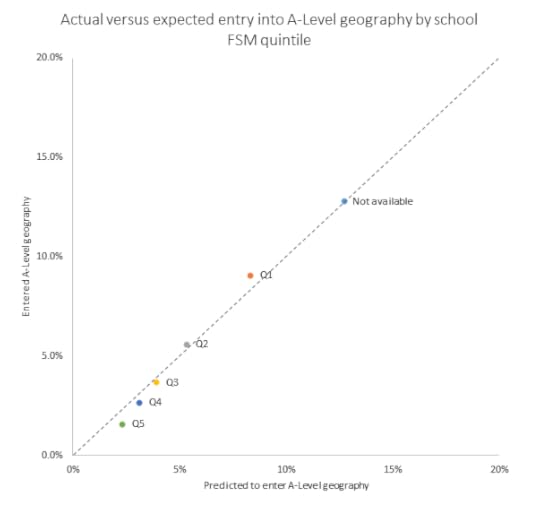
Expected vs actual entry into A-level by Free School Meal Cohort
Actual versus expected entry into A-Level geography by school free school meal quintile. This measure is taken once all other affecting factors have been removed. Source and copyright: Royal Geographical Society (with IBG)
The ratio of inequality between the quintiles can be seen to rise between GCSEs and A levels in England, up to a six-to-one inequality. That ratio of inequality then rises again when we look at who manages to enter university to study Geography. The statistics shown next are divided between Physical Geography and Human Geography because UCAS uses different course codes. Geographers have known for a long time that their subject in England has been tending to attract fewer young people from disadvantaged backgrounds than it should. Interestingly, shows that if the more physical environmental and sustainable sides of the subject are highlighted (and the word Geography is emphasised less) this bias is reduced a little.
When it comes to the study of Geography at all UK universities: in 2019 – of all UK domiciled 18 year old students who were accepted to study human geography – only 4.23% were from the poorest fifth of neighbourhoods by educational achievement as compared to 50.78% who were from the most affluent fifth of such areas (areas which are also home to the most private school pupils). Or, to put it another way, an educationally affluent 18 year old was 50.78/4.23=12.00 times more likely to be accepted to study human geography than a poorer 18 year old in the most recent year for which data is available.
Of 86 other mainstream subjects studied at any UK university, no other has a ratio of social inequality by entry as high as Human Geography had in 2019 – the year before the pandemic. The respective figures for Physical Geography were 6.49 and 41.59 or a ratio of 6.41 (very similar to the A level ratio). That is better, but still not normal for university access in the UK. For studying Mathematics, the ratio was 4.64; Music: 2.71; Sociology 2.10; Social Policy: 1.03. Since this statistic was first measured in 2007 it has worsened, with Human Geography’s social inequality ratio being highest in 2019. If we combine the two sides of Geography the ratio becomes 8.72, less exclusive than Economics but more than European Languages (see table below).
So, what will happen following the debacle of 2020 when both GCSE results and A level results were awarded on teacher recommendations (thankfully) rather than by algorithm? My guess, and at the moment is this:
More young people will study Geography at University in 2020, or with a place deferred until 2021, because more will have been awarded the A level grades allowing them to do this
Almost all the students from the most advantaged fifth of areas would have been going to University anyway so this increase in grades across the board will narrow the access inequality ratio.
The inequality ratio in 2020 for Geography may well narrow by more than most other mainstream subjects as just a tiny number of additional students can alter the ratio so much.
Human and Social Geography (“L7”) is very unlikely to top the list in 2020 when the equivalent figures to those shown in the table below are calculated by UCAS.
Next in the pipeline: more students will stay on at sixth forms in England and take A levels given the large increase in GCSE grades awarded in 2020 (an extra 1 in 10 passing).
This will again have a disproportionate effect on Geography as, again, just a few extra students from backgrounds more likely to be awarded low GCSEs greatly alter graphs such as those above.
Scepticism over the normal work of the exam boards will grow in the coming year. It will be hard for universities to reverse this trend and ignore teachers’ views in future.
For Geography at UK universities, the tide towards greater inequality and less diversity may have turned in 2020, but to ensure it has will take more work. Admissions officers must take more note of what teachers say about pupils from schools and neighbourhoods and social groups that are traditionally at a disadvantage. Geography departments in England must make lower tariff offers to such students, as already now happens in Scotland. The alternative will be a return to the situation in 2019.
Table – 86 subjects ranked by Polar 5 to Polar 1 ratio in 2019, UK universities age 18
Rank
Polar 1
Polar 5
Polar 1
All Students
Ratio
Degree Accepted to Study in UK in 2019
1
4.23%
50.78%
95
2245
12.00
L7 – Human and Social Geography
2
4.65%
51.16%
30
645
11.00
A2 – Pre-clinical Dentistry
3
4.83%
46.90%
35
725
9.71
D1 – Pre-clinical Veterinary Medicine
4
5.15%
50.00%
35
680
9.71
Q8 – Classical studies
5
5.05%
47.05%
270
5345
9.32
L1 – Economics
5.32%
46.36%
230
4325
8.72
L7 and F8 combined (all Geography)
6
6.02%
51.20%
50
830
8.50
R9 – European Languages and Lit
7
6.54%
47.06%
50
765
7.20
RR – Combinations within European Langs…
8
6.34%
45.32%
335
5285
7.15
A1 – Pre-clinical Medicine
9
4.46%
30.36%
25
560
6.81
B5 – Ophthalmics
10
6.67%
44.10%
65
975
6.61
V5 – Philosophy
11
6.49%
41.59%
135
2080
6.41
F8 – Physical geographical sciences
12
7.21%
45.19%
75
1040
6.27
Y Combs of social studies/bus/law with langs
13
7.01%
41.82%
135
1925
5.97
Y Combs of soc studies/law with business
14
6.12%
36.05%
45
735
5.89
F6 – Geology
15
7.06%
41.00%
290
4110
5.81
L2 – Politics
16
7.60%
44.13%
285
3750
5.81
Z Combs of 3 subjects, or other general…
17
6.45%
36.13%
50
775
5.60
F7 – Science of aquatic & terrestrial environ.
18
7.27%
36.82%
80
1100
5.06
N3 – Finance
19
7.39%
35.80%
95
1285
4.84
K2 – Building
20
8.14%
37.74%
360
4425
4.64
G1 – Mathematics
21
8.51%
38.65%
120
1410
4.54
H8 – Chemical, Process and Energy Engineering
22
8.69%
39.26%
455
5235
4.52
N2 – Management studies
23
8.89%
40.00%
60
675
4.50
Y Combs of languages
24
8.65%
38.78%
135
1560
4.48
LL – Combinations within Social Studies
25
8.84%
37.83%
285
3225
4.28
Y Combs of soc. Stud./bus/law with arts/hum.
26
9.35%
40.00%
540
5775
4.28
V1 – History by Period
27
9.10%
38.40%
365
4010
4.22
H3 – Mechanical Engineering
28
8.29%
34.46%
160
1930
4.16
H2 – Civil Engineering
29
9.27%
37.86%
290
3130
4.08
F3 – Physics
30
8.84%
35.99%
205
2320
4.07
B1 – Anatomy, Physiology and Pathology
31
7.61%
30.98%
70
920
4.07
D4 – Agriculture
32
9.38%
37.50%
60
640
4.00
Y Combs of phys /math/comp sciences
33
9.38%
36.42%
380
4050
3.88
C1 – Biology
34
9.09%
34.32%
200
2200
3.78
N5 – Marketing
35
9.94%
36.77%
530
5330
3.70
N1 – Business studies
36
10.25%
37.63%
290
2830
3.67
Y Combs of languages with arts/humanities
37
9.93%
36.14%
265
2670
3.64
H1 – General Engineering
38
9.57%
33.91%
220
2300
3.54
K1 – Architecture
39
10.13%
34.97%
310
3060
3.45
F1 – Chemistry
40
10.47%
35.39%
500
4775
3.38
Q3 – English studies
41
10.07%
33.68%
145
1440
3.34
H6 – Electronic and Electrical Engineering
42
10.25%
33.50%
205
2000
3.27
H4 – Aerospace Engineering
43
11.03%
35.29%
75
680
3.20
VV – Combinations within Hist & Phil. studies
44
11.11%
34.87%
145
1305
3.14
Y Combs of phys/math with soc. Stud./bus/law
45
11.30%
34.46%
100
885
3.05
L6 – Anthropology
46
10.75%
32.64%
285
2650
3.04
C7 – Molecular Biology, Biophysics & Biochem
47
10.84%
32.79%
630
5810
3.02
NN – Combs. within Business & Admin Studies
48
9.74%
27.01%
285
2925
2.77
N4 – Accounting
49
11.84%
32.03%
425
3590
2.71
W3 – Music
50
10.70%
28.79%
275
2570
2.69
B2 – Pharmacology, Toxicology and Pharmacy
51
10.04%
26.25%
130
1295
2.61
C9 – Others in Biological Sciences
52
11.54%
29.80%
740
6410
2.58
W2 – Design studies
53
12.14%
31.07%
125
1030
2.56
C3 – Zoology
54
11.34%
27.53%
140
1235
2.43
Y Combs of social studies/law
55
12.30%
29.53%
910
7400
2.40
I1 – Computer Science
56
12.11%
28.13%
155
1280
2.32
P5 – Journalism
57
12.65%
28.77%
1660
13120
2.27
C8 – Psychology
58
12.11%
27.21%
425
3510
2.25
P3 – Media studies
59
13.64%
30.30%
90
660
2.22
WW – Combs. within Creative Arts and Design
60
12.67%
28.02%
1485
11725
2.21
M1 – Law by Area
61
13.61%
30.00%
415
3050
2.20
W6 – Cinematics and Photography
62
13.29%
29.11%
105
790
2.19
Y Combs of arts/humanities
63
11.48%
25.14%
105
915
2.19
B8 – Medical Technology
64
12.18%
26.24%
615
5050
2.15
B9 – Others in Subjects allied to Medicine
65
12.96%
27.23%
640
4940
2.10
L3 – Sociology
66
13.44%
27.97%
305
2270
2.08
N8 – Hospitality, leisure, sport, tourism & transport
67
13.77%
27.29%
285
2070
1.98
Y Combs of science/eng. with social studies/bus/law
68
12.68%
24.88%
130
1025
1.96
M2 – Law by Topic
69
14.23%
27.64%
175
1230
1.94
Y Combs of science/eng. with arts/humanities/languages
70
13.49%
25.12%
145
1075
1.86
W1 – Fine Art
71
13.51%
24.66%
200
1480
1.83
Y Combs of med/bio/agric sciences
72
14.42%
25.80%
450
3120
1.79
W4 – Drama
73
14.25%
24.97%
1130
7930
1.75
C6 – Sport and Exercise Science
74
13.35%
22.89%
420
3145
1.71
X1 – Training Teachers
75
16.09%
25.29%
140
870
1.57
I3 – Software Engineering
76
14.60%
21.17%
100
685
1.45
I2 – Information Systems
77
15.89%
22.43%
85
535
1.41
II – Combinations in Computer Sciences
78
17.48%
23.79%
180
1030
1.36
D3 – Animal Science
79
16.53%
21.49%
100
605
1.30
W5 – Dance
80
15.28%
19.82%
505
3305
1.30
X3 – Academic studies in Education
81
17.01%
19.23%
1150
6760
1.13
B7 – Nursing
82
19.20%
20.40%
240
1250
1.06
F4 – Forensic and Archaeological Science
83
20.27%
20.95%
150
740
1.03
L4 – Social Policy
84
19.14%
19.47%
290
1515
1.02
M9 – Others in Law
85
21.84%
19.16%
285
1305
0.88
I6 – Games
86
21.53%
14.85%
435
2020
0.69
L5 – Social Work
Note: data rounded to nearest five in the original source files to preserve anonymity. And a combined geography total added (unranked).
Source: Kernohan, D. (2020) % POLAR4 Q1 vs % POLAR4 Q5 – 2019 cycle by JACS principal subject, UCAS Acceptances, UK domiciled 18 year olds, Public Tableau of UCAS data, July 6th, https://public.tableau.com/profile/david.kernohan#!/vizhome/Principalsubject-POLAR/Sheet1
About the Author: Danny Dorling is the Halford Mackinder Professors in Geography at the University of Oxford. He is a social and political geogrpaher with a particular interest in inequalities. He is an Academician of the Academy of the Learned Societies in the Social Sciences, was the Honorary President of the Society of Cartographers for ten years and is a patron of Roadpeace, the national charity for road crash victims. Much of Danny’s work is available open access (see www.dannydorling.org) and his most recent book is Slowdown.
Suggested further reading
McIlwaine, C, Bunge, D. (2019). Placing diversity among undergraduate Geography students in London: Reflections on attainment and progression. Area. 51: 500– 507. https://doi.org/10.1111/area.12506
Dorling, D. (2019). Kindness: A new kind of rigour for British Geographers. Emotion, Space and Society, 33, 100630. https://doi.org/10.1016/j.emospa.2019.100630
Wyse, S, Page, B, Walkington, H, Hill, JL. Degree outcomes and national calibration: Debating academic standards in UK Geography. Area. 2019; 52: 376– 385. https://doi.org/10.1111/area.12571
geography, diversity, Covid-19, coronavirus, a level, GCSE, OFQUAL, socio-economic background
for a PDF of this article and a link to where it was first published click here.


Danny Dorling's Blog

- Danny Dorling's profile
- 96 followers

