How statistics can be right but still misleading
 We are bombarded with statistics all the time in the news, on social media, from government and science. Sometimes they are very useful. At other times they are simply wrong. But there's an in-between way to use statistics - deliberately or otherwise - that is both accurate and misleading.
I just want to give two examples, though there are many more out there. If you want to find out more about the use and misuse of statistics, I'd recommend my book Dice World on the impact of randomness, probability and statistics on our lives and David Spiegelhalter's book The Art of Statistics to get an introduction to how statistics are created, used and misused.
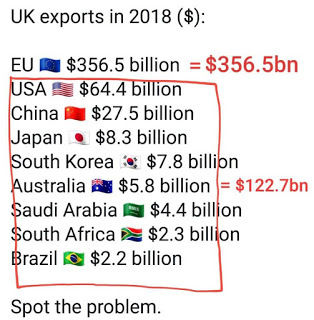
The first example is a deliberate attempt to mislead. The graphic at the top right has been circulated on Facebook. The idea is the this demonstrates the problem with Brexit by showing how important the EU is to us an export market. It doesn't matter if you agree or disagree with Brexit, the issue here is how the numbers are being used. I'd say there are three distortions here. The first is that it's perfectly possible to have Brexit and not to damage EU exports. Secondly, the numbers are bizarrely stated in US dollars - the only reason I can think for this is that it makes the EU amount seem bigger. Finally, there's the matter of the dog that didn't bark. Because around $350 billion of non-EU exports is missing. Bear in mind, I'm not saying the numbers are wrong - the EU is a hugely important market for the UK. But to omit around the same amount of non-EU exports as there are EU exports could only have been done to make the EU seem more important than it really is. That's bad, and clearly deliberate.
 More subtle is something that happened when it was announced that eating bacon increased your risk of bowel cancer. We saw headlines like this in the Guardian, pointing out that eating a couple of rashers of bacon a day 'would raise the risk of getting bowel cancer by 18% over a lifetime.' This is true, but with a huge proviso. That 'risk', which sounds terrifyingly huge, is a relative risk, not an absolute one. It's the increase in risk in what is a relatively low risk overall. If you turn that into an absolute risk - which is what most readers would expect - i.e. if I eat bacon every day what is the chance that it will give me cancer over my lifetime, the risk is not 18% but 1%. That feels rather different. It's still a risk - it's still important to know. But it's far more meaningful than the relative risk. Again, the statistics are accurate (though their interpretation may not be: former University College pharmacology professor David Colquhoun has argued strongly from earlier versions of the data that the interpretation is suspect because there is only weak evidence of causality) - but the way it is presented (either intentionally or accidentally) is highly misleading.
No one is saying we should ignore statistics. But we need to be careful about taking what we read in the papers (or even more so on social media) at face value. At the very least, if it's not possible to dig down and see where the numbers come from we should be highly suspicious.
Published on April 08, 2019 08:15
No comments have been added yet.


