
Recession Watch, August 2016
The implications of the tradables sector, the dollar, and Fed policy.
The employment numbers released on Friday were re-assuring, especially in light of the previous week’s GDP figures. But can we rule out an ongoing or incipient recession?
Figure 1 depicts the series that the NBER Business Cycle Dating Committee (BCDC) has in the past focused on.
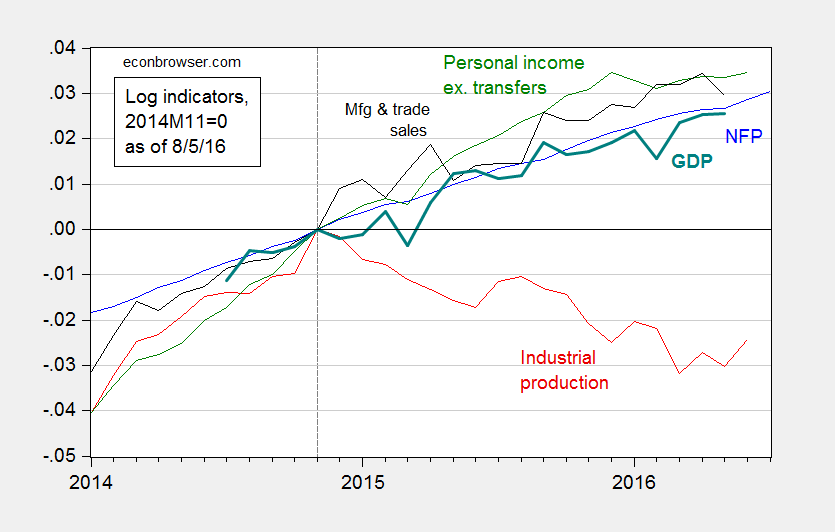
Figure 1: Log nonfarm payroll employment (blue), industrial production (red), personal income excluding transfers, in Ch.2009$ (green), manufacturing and trade sales, in Ch.2009$ (black), and Macroeconomic Advisers monthly GDP series (bold teal), all normalized to 2014M11=0, all as of August 5. Source: BLS (July release), Federal Reserve (June release), Macroeconomic Advisers (July 19), and author’s calculations.
All series have risen, save industrial production, since the IP peak in 2014M11. That decline is fairly marked, a 2.5% decline (in log terms). The initial read on June manufacturing and trade sales was also down.
Now, industrial production is less representative of overall output than it has been in the past. Nonetheless, it’s still a very important component. Value added in mining, utilities and manufacturing accounted for 19.2% of GDP in 1997, and still accounted for 15.4% in 2015. Hence, this drop is worrisome.
Why the decline? While manufacturing has not subtracted from industrial production, it has not added. Figure 2 shows the manufacturing production index (red line). The June 2016 value is the essentially the same as at the prior peak value in November 2014. (Manufacturing accounts for 12.1% of value added.)
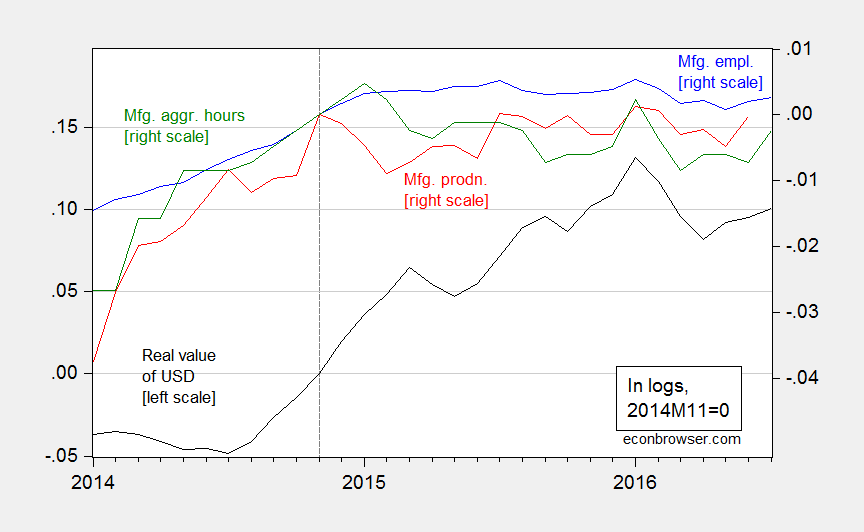
Figure 2: Real value of the US dollar against broad basket (black, left scale), manufacturing production (red, right scale), manufacturing employment (blue, right scale), aggregate hours index for manufacturing production and nonsupervisory workers, all in logs, 2014M11=0. Source: Federal Reserve Board, BLS, and author’s calculations.
The stagnation in employment and aggregate hours can be attributed, at least in part, to the 15% appreciation in the real value of the dollar since 2014M07. While the dollar is down since its recent peak, that decline is only 3%.
This is where Fed policy is of particular relevance. Fed funds futures indicate an 82% likelihood of a 25-50 bps increase by September 21 [CME, accessed 8/8]. (18% is for a 50-75 bps.) To the extent that one of the few things we know moves the dollar is the interest rate (and expectations of future interest rates), further tightening seems ill-advised.
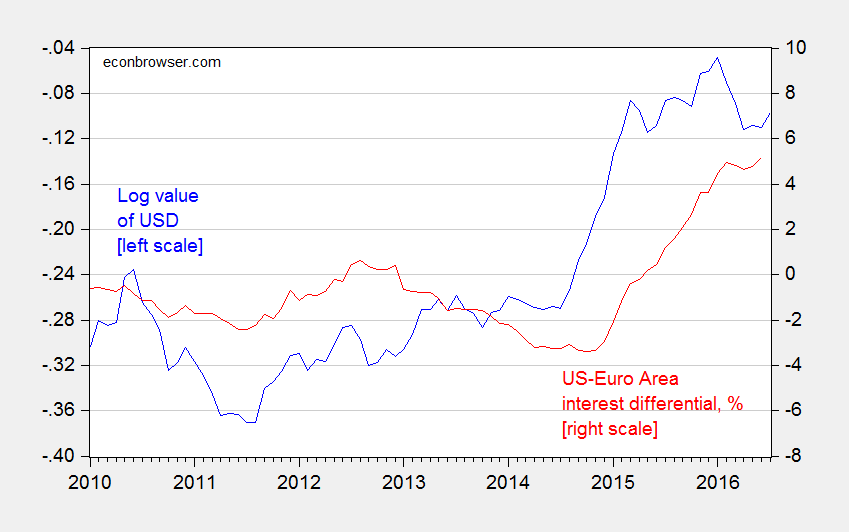
Figure 3: Log nominal value of US dollar (major currencies) (blue, left scale), and US-euro area interest differential, including shadow rates, % (red, right scale). Source: Fed, ECB, Wu-Xia, author’s calculations.


Menzie David Chinn's Blog


