
Observational Equivalence? Conspiracy Theory Kooks vs. Statistical Incompetence
Remember this Political Calculations blogpost asserting that BEA, by virtue of releasing statewide GDP figures, was unwittingly telegraphing a massive downward revision in GDP come the July 29th benchmark revision? That development failed to occur. In fact GDP was on average revised up release [pdf].
First, let’s review the original graph asserting wildly different stories from the state level GDP series and the national.
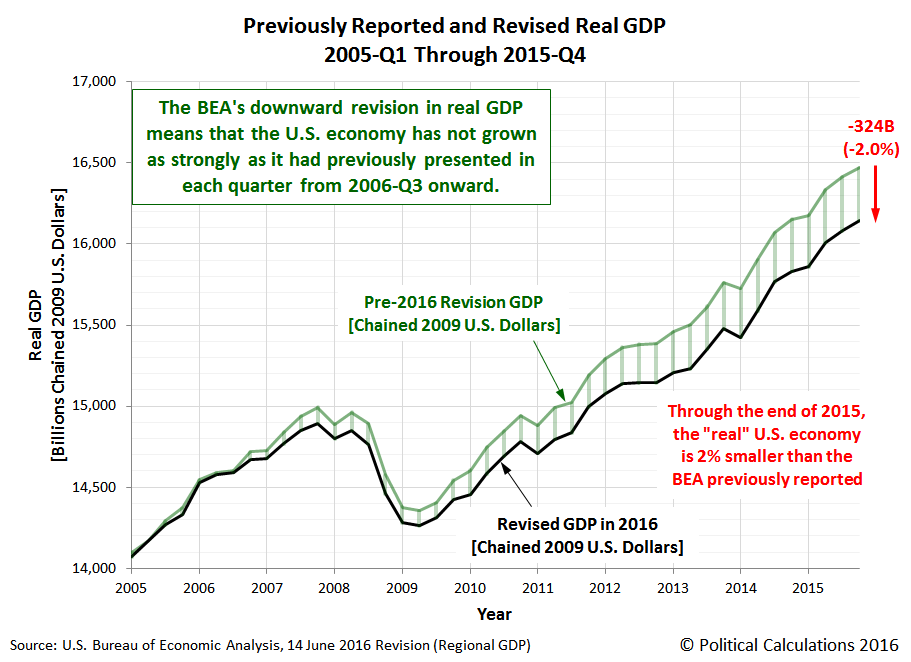
There were subsequent amendations (e.g., 18 June update to the original post), but the basic story remained unchanged. Instead of the originally estimated 324 billion Ch.2009$ downward revision, a 226 billion was predicted (18 June).
As it turns out, here in Figure 1 is what pre-revision national GDP (green) and summed state level GDP (black) look like, compared to the post-benchmark revised GDP (red).
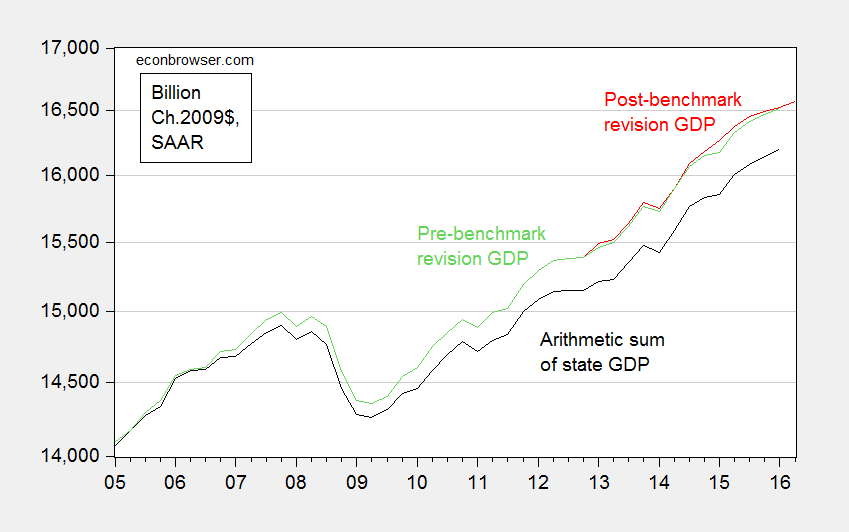
Figure 1: Real GDP pre-benchmark revision (green), post-benchmark revision (red), and arithmetic sum of state level GDP (black), all in Ch.2009$ SAAR. Source: BEA 2016Q1 3rd release, 2016Q2 advance release, BEA state level quarterly GDP, revision of 27 July 2016, and author’s calculations.
As shown, 2015Q4 real GDP was revised upwards, albeit only a small amount — 20.1 billion Ch.2009$ (SAAR) (10.4 billion in 2016Q1). The average revision over the 3 year revision period was 28.7 billion, or 0.2% in log terms.
Why did Political Calculations get it so wrong? Was it just bad luck? The answer is no. And this could’ve been determined the day this prediction was made. And in fact, I pointed out this issue back on June 18; additional reasons for doubt in comments from Ben Arownd.
The key to understanding where Political Calculations went wrong is to look to the nominal GDP figures from the national level and state level sources. Figure 2 depicts the two series.
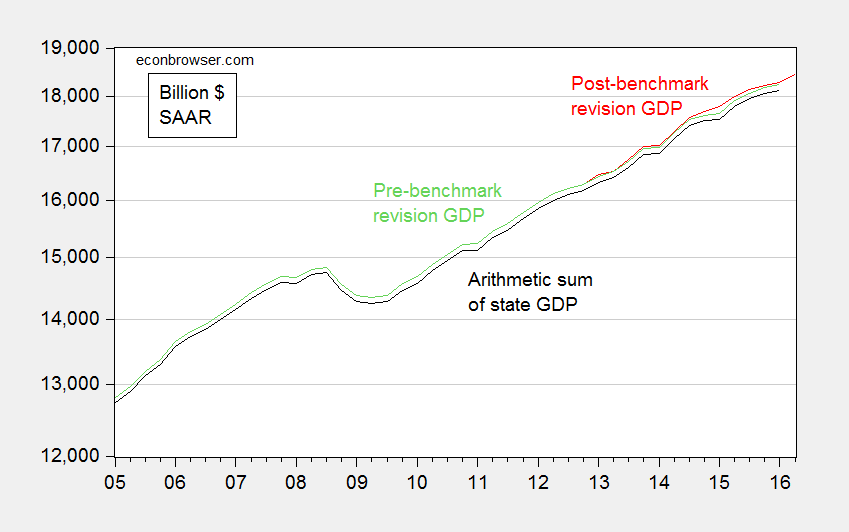
Figure 2: Nominal GDP pre-benchmark revision (green), post-benchmark revision (red), and arithmetic sum of state level GDP (black), all in current dollars SAAR. Source: BEA 2016Q1 3rd release, 2016Q2 advance release, BEA state level quarterly GDP, revision of 27 July 2016, and author’s calculations.
The gap between the two series, which are the nominal analogs to those in Figure 1, is relatively small and only slightly time varying. It would be hard conceive of seeing a big revision in real magnitudes, and a small one in nominal. This suggests PC’s interpretation of the widening gap in Figure 1 was mistaken.
In fact, the widening gap is due to inappropriate treatment of chain-weighted variables. In particular, using the simple arithmetic sum of the chain weighted state level GDP series provided an inaccurate measure of national level chain weighted GDP. It’s only on 27 July, 2 days before the benchmark revision release (29 July) did Political Calculations realize the nature of the error.
Hence, it appeared that the misunderstanding of the characteristics of chain-weighted indices combined with a preternatural disposition toward conspiracy theories led to a wildly off-the-mark prediction.
Let that be the lesson: know your data!


Menzie David Chinn's Blog


