
Was The Democratic Primary A Close Call Or A Landslide?
Hillary Clinton will officially become the Democratic nominee for president this week, at which point we’ll finally close the chapter on the 2016 primaries. But when we look back on the 2016 race, how should we think of it, as a close call or as a blowout? Could a few small changes have made Sanders the nominee — and could a higher-profile candidate such as Elizabeth Warren have beaten Clinton, when Sanders didn’t?
My view is that the race wasn’t really all that close and that Sanders never really had that much of a chance at winning. From a purely horse-race standpoint, in fact, the media probably exaggerated the competitiveness of the race. But that’s not to diminish Sanders’s accomplishments in terms of what they mean for the Democratic Party after 2016. It’s significant that Sanders in particular — and not Warren or Joe Biden or Martin O’Malley — finished in second place.
There’s no agreed-upon standard for determining whether a nomination campaign was close or lopsided. Delegates might seem like the logical starting point; Clinton beat Sanders by 359 pledged delegates, and 884 delegates overall (counting superdelegates). But delegates don’t make for easy historical comparisons because the rules for delegate allocation change from party to party and election to election. As FiveThirtyEight contributor Daniel Nichanian pointed out, Clinton would have had a gargantuan win in pledged delegates — perhaps in excess of 1,000 delegates more than Sanders — if the Democratic nomination had been contested under Republican primary rules, which are winner take all or winner take most in many states. There’s also that sticky question of how to count superdelegates.
An alternative is to look at the aggregate popular vote, which makes for easier comparisons to past elections. According to The Green Papers, Clinton won 16.8 million votes to 13.2 million for Sanders, or about 55 percent of the vote to his 43 percent, a 12 percentage point gap.1
If Clinton had won by that sort of margin in a general election, we’d call it a landslide; her margin over Sanders was similar to Dwight D. Eisenhower’s over Adlai Stevenson in 1952, for example, when Eisenhower won the Electoral College 442-89. By the standard of a primary, however, Clinton’s performance was more pedestrian. The 55 percent of the popular vote she received is somewhat above average, in comparison to other open nomination races2 since 1972. Her 12-point margin of victory over her nearest opponent, Sanders, is below-average.
YEARPARTYNOMINEESHARE OF POPULAR VOTEPOPULAR VOTE MARGIN OF VICTORY2000DAl Gore75%+541988RGeorge H.W. Bush68+492000RGeorge W. Bush62+312004DJohn Kerry61+421980RRonald Reagan60+241996RBob Dole59+382016DHillary Clinton55+121992DBill Clinton52+322012RMitt Romney52+322008RJohn McCain47+252008DBarack Obama47-12016RDonald Trump45+201988DMichael Dukakis42+131976DJimmy Carter40+261984DWalter Mondale38+21972DGeorge McGovern25-1Which candidates dominated their nomination races?Sources: The Green Papers, Rhodes Cook, US Election Atlas, Wikipedia
That potentially understates Clinton’s performance, however, because Sanders never dropped out when a lot of other candidates in his position did, allowing the eventual nominee to run up the score in uncontested races. For instance, if you look at George W. Bush’s performance in the 2000 primary, it at first appears utterly dominant: He won 62 percent of the popular vote and beat his nearest rival, John McCain, by 31 percentage points.
But McCain dropped out of the race relatively early, after losing seven of nine states on Super Tuesday. At the time McCain dropped out, Bush led the popular vote only 51-43, less than the margin by which Clinton beat Sanders. Because of Republicans’ winner-take-all rules, McCain didn’t stand much chance of a comeback. (Then again, as I’ll argue later, Sanders never had much of a chance, either, after Super Tuesday.)
So we can rerun the previous table, this time freezing the numbers if and when the second-place candidate dropped out after Super Tuesday. Paul Tsongas was second in the popular vote to Bill Clinton when Tsongas dropped out in mid-March 1992, for example, so we’ll consider the race to have ended there, even though Jerry Brown continued a quixotic bid against Clinton and eventually lapped Tsongas into second.
POPULAR VOTEYEARPARTYNOMINEESHAREMARGIN OF VICTORYTOTALS THROUGH2000DAl Gore72%+46Bradley dropping out1996RBob Dole59+38End of race1988RGeorge Bush55+30Dole dropping out2016DHillary Clinton55+12End of race2004DJohn Kerry54+29Edwards dropping out2000RG.W. Bush51+8McCain dropping out1992DBill Clinton50+23Tsongas dropping out1980RRonald Reagan50+19Bush dropping out2008DBarack Obama47-1End of race2012RMitt Romney42+15Santorum dropping out1988DMichael Dukakis42+13End of race1976DJimmy Carter40+26End of race2016RDonald Trump40+13Cruz dropping out2008RJohn McCain38+6Romney dropping out1984DWalter Mondale38+2End of race1972DGeorge McGovern25-1End of raceWhich nominees were dominating when their top opponent quit?Sources: The Green Papers, Rhodes Cook, US Election Atlas, Wikipedia
Hillary Clinton’s performance is more impressive on this basis, given that Sanders contested the race to the end. Measured in this way, the 55 percent of the popular vote she received is tied for third-most out of 16 nominees, after Al Gore in 2000 and Bob Dole in 1996. And her 12-point margin over Sanders is roughly average, instead of below average.
But the calculation also potentially overstates the closeness of the Democratic race. College football stat geeks are fond of a concept called game control, which reflects how dominant the winning team was from start to finish. For instance, if Michigan State goes up two touchdowns early in a game against Ohio State, and Ohio State never makes it any closer than that, Michigan State will get a high game-control score even if they eventually win by “only” 17 points. By contrast, a team that trailed at halftime but eventually wins by 21 points after piling on in the fourth quarter won’t be considered all that dominant.
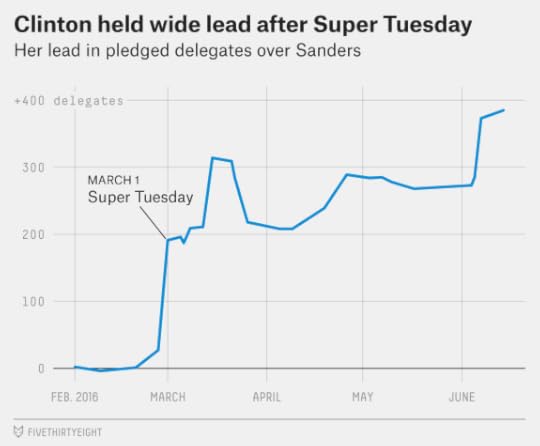
By this measure, Clinton was quite dominant. She trailed Sanders in pledged delegates only once, after Sanders won New Hampshire early on. But she regained the pledged delegate lead after Nevada and never looked back. After Super Tuesday on March 1, Clinton had a lead of 191 pledged delegates, and it never dropped below 187 pledged delegates the rest of the way:
Betting markets, although not a perfect measure, also remained extremely confident about Clinton’s chances from start to finish. According to Betfair, her probability of becoming the Democratic nominee shot up to 83 percent in October 2015 after Biden announced his intention not to run. From that point forward, her chances never dropped below 76 percent.
One reason for this confidence is that the Democratic race was quite predictable along demographic lines from start to finish. Polls and early results immediately made clear that Sanders would perform well in whiter states, while Clinton would perform well in states with substantial numbers of African-American and Hispanic voters. Before long, we also learned that Clinton tended to perform better in primaries — especially closed primaries — while Sanders did better in caucuses. Thus, once Clinton achieved victories in a series of diverse states in late February and early March — Nevada, South Carolina and the Super Tuesday states — it became fairly easy to extrapolate the rest of the race. Even states where the polls turned out to be wrong — underestimating Sanders in Michigan and Indiana or overestimating him in California, for example — weren’t that surprising on the basis of their demographics.
Related:

Nate Silver's Blog

- Nate Silver's profile
- 730 followers

