
Contextualizing the North Carolina Experience
Defenders of the Kansas and Wisconsin misadventures in supply side economics keep on pointing to North Carolina as the counter-example that proves tax cuts do prompt faster growth (e.g., [1] [2]). A quick look at the data provides the following observations: (1) North Carolina GDP growth has merely matched nationwide growth since 2013Q1, (2) NC GDP has just been revised downward so that 2015Q3 GDP is now 1.5% lower than previously thought, and (3) NC GDP is less than the counterfactual indicated by historical correlations with national GDP.
Here’s an example of a statement that asserts tax cuts at the state level (combined with spending cuts due to balanced budget requirements) are expansionary:
Clearly the case of North Carolina throws water on the idea that reductions in gov’t spending are, generally speaking, a drag on economic growth. You seem to want to focus exclusively on the case of Kansas and completely ignore NC. Why?
First, not so sure about the first assertion. On the second point, I agree I have not paid enough attention to North Carolina. Let’s remedy that by looking at actual data!
North Carolina and the US
While NC GDP growth has accelerated relative to pre-2013, that has been an acceleration to match roughly the growth rate experienced over 1997-2015 period, and hence to match the US growth rate. This is shown in Figure 1.
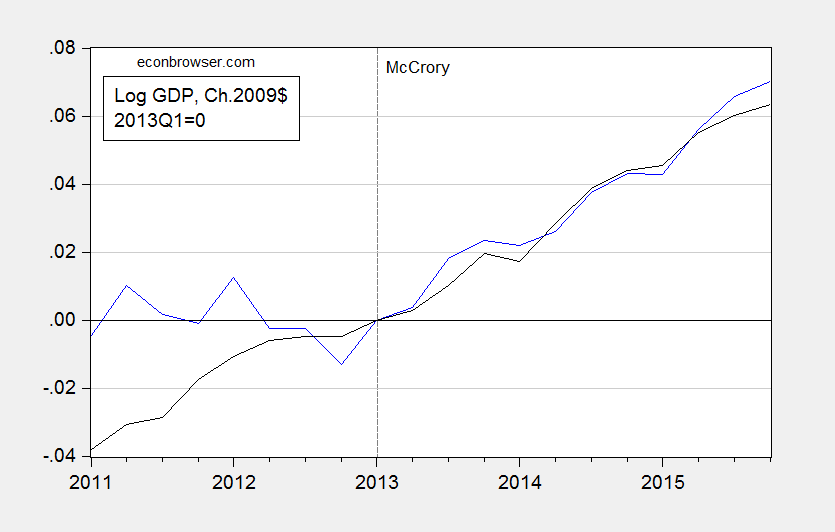
Figure 1: North Carolina GDP (blue), and US GDP (black), both in Ch.2009$, 2013Q1=0. Source: NC from state GDP release (June), and US from NIPA (2016Q1 2nd release).
Hardly a miracle. And there is more.
Revisions Take Off Some of the Gloss
In the latest release, quarterly GDP for North Carolina was revised downward perceptibly over the post-recession period. These downward revisions were particularly marked during the period starting from about mid-2013, right after Governor McCrory’s term began. This is shown in Figure 2.
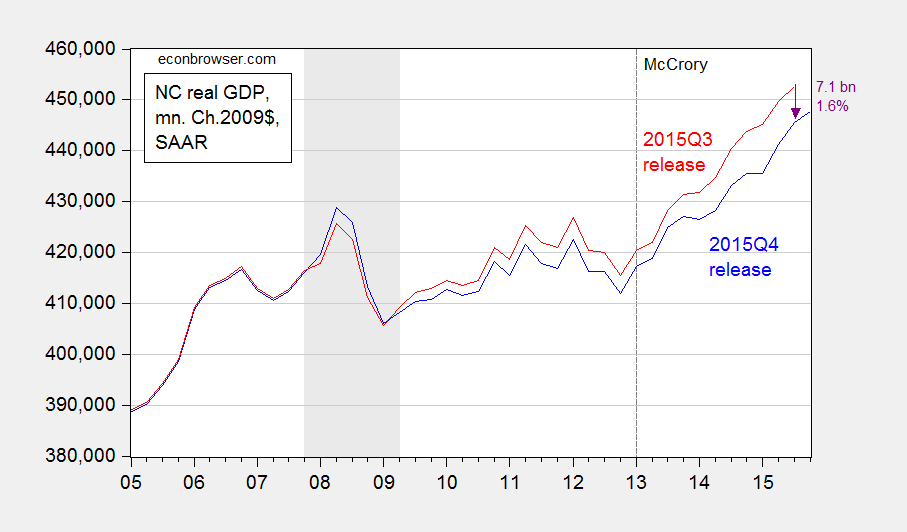
Figure 2: North Carolina GDP from 2015Q4 release (blue), and from 2015Q3 release (red). NBER defined recession dates shaded gray. Source: BEA and NBER.
North Carolina GDP in 2015Q3 has been revised downward by 1.6%, and over the 2013Q1-2015Q3 period was revised downward by 1.4% (in log terms).
Assessment against a Counterfactual
One way in which to more formally assess the impact of the policy framework implemented since 2013Q1 is to compare the actual outcomes, with respect to output, employment, income, etc., against a counterfactual. Following a procedure that I have used for Kansas [3], in terms of GDP, I retrieve data for 1997 to 2015, estimate the relationship between US and North Carolina GDP (incorporating a long run cointegrating relation), up to 2012, and then use the resulting equation to dynamically forecast out of sample the counterfactual. The estimated equation is:
(1) ΔyKSt = 0.419 – 0.142yNCt-1 + 0.148 yUSt-1 + 0.642ΔyUSt + 0.186 ΔyNCt-1 + ut
Adj-R2 = 0.39, SER = 0.0073, N = 62, DW = 1.84, Breusch-Godfrey Serial Correlation LM Test = 1.24 [p-value = 0.30]. Bold face denotes statistical significance at 10% msl, using HAC robust standard errors. y denotes log real GDP.
Figure 3 depicts the forecast, the actual and the 90 and 50 percent prediction intervals.
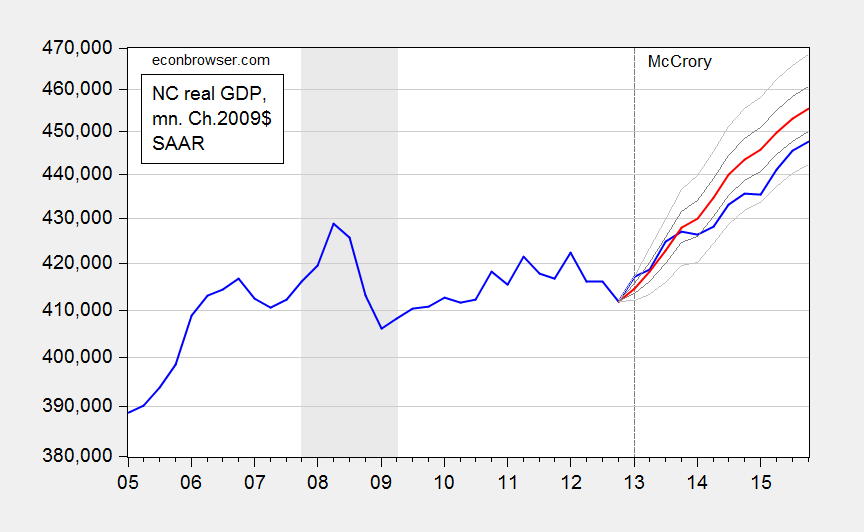
Figure 3: North Carolina GDP (blue), dynamic ex post simulation (red), 50% prediction interval (dark gray), and 90% prediction interval (light gray). NBER defined recession dates shaded gray. Source: BEA, NBER, and author’s calculations.
My calculations indicate that NC GDP as of 2015Q4 was 7.4 billion Ch.2009$ lower (SAAR) than that indicated by the level of US GDP. That is 1.6% (in log terms).
In contrast to my results for the case of Kansas, I cannot reject the null hypothesis that the level of GDP is within the 90% prediction interval. On the other hand, a less stringent 50% criterion suggests that the outcome is significantly worse than what we should have observed, based on the historical relationship between US and NC GDP.
Details of Estimation/Simulation
Step 1. I extended backward in time NC GDP to 1997 by using quadratic interpolation applied to annual data, and splicing this GDP series to reported quarterly GDP series. This step was necessitated because I could not reject the null of no cointegration using only the 2005-2012 period data.
Step 2. I apply unit root tests to log NC real GDP and US real GDP. They both fail to reject the ADF unit root tests (with constant, trend) at the 10% msl.
Step 3. I apply the Johansen cointegration test (constant in cointegrating vector, VAR) with 1 lag of first differences (2 lags in levels), and reject the no cointegration null at 10% msl. I fail to reject one cointegrating vector in favor of two.
Step 4. I estimate the error correction model (ECM) indicated in equation (1).
Step 5. I use the estimated ECM to conduct an ex post historical simulation, i.e., taking as given the actually realized values of US GDP to forecast NC GDP. This yields the red line in Figure 3.
Conclusion
A consistent meme forwarded by those who persistently view North Carolina as a counterpoint to the Kansas situation is that tax cuts accompanied by spending cuts have failed to reduce NC GDP growth, and in fact spurred growth, counter to the austerity-cum-recession thesis. This observation is true for NC relative to pre-2013 growth. However, to the extent that economists are wont to use the ceteris paribus proviso, we should be comparing not against pre-shock growth rates, but against a counterfactual. And doing so suggests that the policies have not accelerated, but rather decelerated, growth.
The manner in which I constructed the counterfactual can surely be criticized. But at least I have provided one. Adherents of the ALEC-Laffer-Moore-Williams Weltanschauung have yet to provide a statistically founded alternative.


Menzie David Chinn's Blog


