
Drumpfarmageddon, Tabulated
Heretofore, I’ve approached in a piecemeal manner the assessment of the impact of massive tax cuts for the wealthy, building a really, really great wall, a final solution for the presence of undocumented immigrants, and the imposition a 45% tariff on Chinese imports. Moody’s Mark Zandi et al. have now done the hard work of trying to figure out what the macro impacts would be to implementing Mr. Trump’s agenda.
Figure 1 depicts realized real GDP (bn. Ch.2009$) through 2015, baseline (“current law”) GDP forecast through 2026, and GDP taking Trump at face value, and Trump lite (essentially, a smaller tax cut imposing only a revenue loss of 3.5 trillion dollars on a ten year basis).
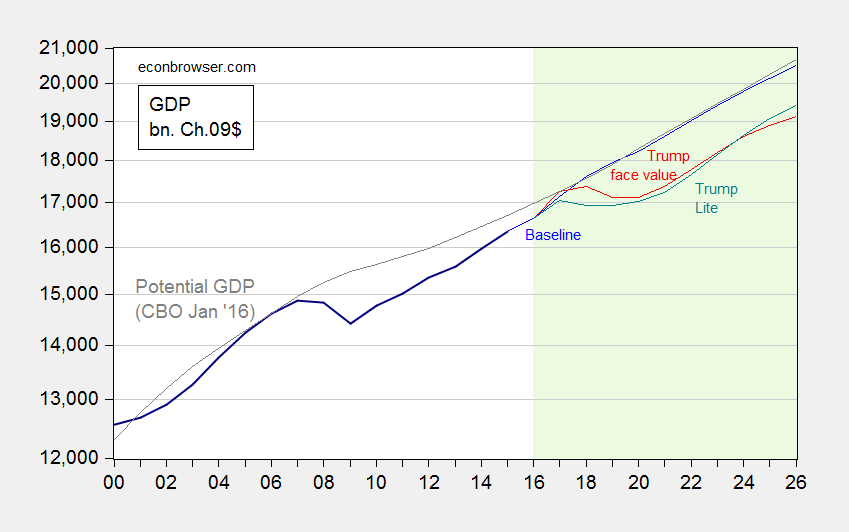
Figure 1: Real GDP (dark blue), current law baseline (blue), under Trump agenda (red), under Trump-Lite scenario (teal), and potential GDP (gray). Light green shaded area denotes forecast period. Source: BEA, CBO (January 2016), and Zandi, et al. The Macroeconomic Consequences of Mr. Trump’s Economic Policies, June 17, 2016..
The cumulative loss relative to baseline GDP would be about 9.5 trillion Ch.2009$ in the Trump at face value scenario. Under Trump Lite, it’s 10.3 trillion Ch.2009$. (I don’t do the comparison relative to potential GDP, because almost surely, potential GDP would decline as the labor force shrank with the establishment of deportation processing centers, and eventual deportation of the undocumented.) For the sake of comparison, the cumulative GDP loss relative to potential GDP over the 2008-2015 period is 5.2 trillion Ch.2009$. In other words, the economic consequences of Mr. Trump would be larger — in terms of lost output — than the Great Recession.
It is also of interest to see the implications for debt-to-GDP ratios.
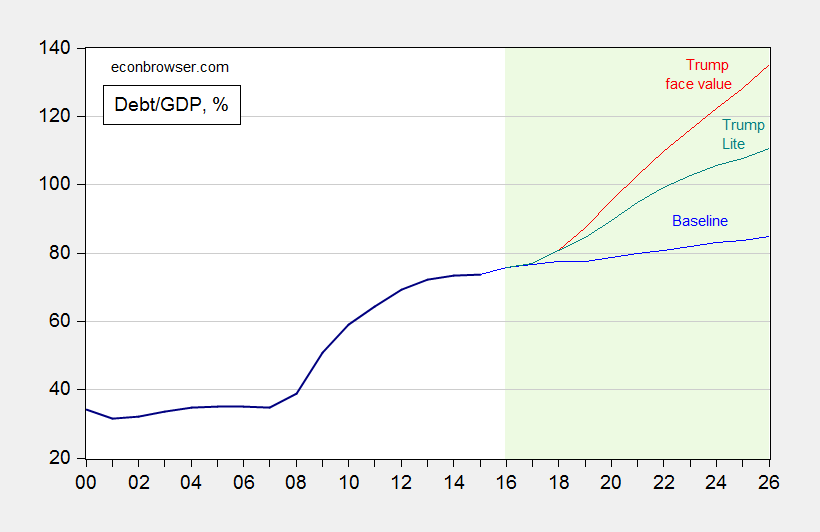
Figure 2: Debt to GDP (dark blue), current law baseline (blue), under Trump agenda (red), and under Trump-Lite scenario (teal). Light green shaded area denotes forecast period. Source: BEA, Fed via FRED, and Zandi, et al. The Macroeconomic Consequences of Mr. Trump’s Economic Policies, June 17, 2016..
Debt rises to 135% of GDP under Trump at face value, 111% under Trump lite, compared to 85% under current law. Notice that the plotted series is the debt held by the public, divided by GDP. Total Federal debt would be even higher.
On the plus side, under the Trump at face value scenario, the threat of deflation would be completely defeated — inflation in 2018 would surge to 5.4%.
Note: Not all provisions are scored. From the report:
Mr. Trump has brought up other potentially relevant economic policies that are not included here since either their macroeconomic impact is too small or they are at this point not sufficiently developed to quantify. These include, for example, his recent energy policy proposals, his seeming support for higher state-level minimum wages, and his ruminations on negotiating with investors in U.S. Treasury bonds and on bringing back the gold standard.


Menzie David Chinn's Blog


