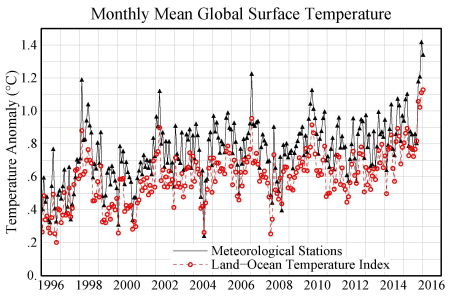
Last month Earth’s temperature soared to a record high. This graph, which only goes up to January, shows how much higher the Earth’s surface temperature is than the 1951-1980 average. It’s updated each month by the Goddard Institute of Space Studies, and it’s called GISTEMP. As you can see, we’re currently experiencing a huge spike in temperatures! It has not abated since January: it’s gotten bigger.
GISTEMP relies heavily on meteorological stations. Upper atmosphere temperatures measured b...
Published on March 03, 2016 08:36
