Vishal Lambe's Blog
April 14, 2016
Feature Scaling - Subtract Mean and Divide by Standard Deviation
Another example is that of predicting the price of the house based on features like number of bedroom, vicinity to school/hospital, number of floors, total area in square feet and age of the house. On this case too, we cannot directly compare the features of the house as they all have different units of measurement; also they possess different range of values.
Hence before comparing them, we must first remove the bias of scaling unit as well as bring them to a similar range of values.
Feature scaling is therefore a method used to standardize the range of independent variables or features of data.
Supposing our feature is X, the normalized form of X would be:
X_Norm=(X-mean(X)) / StandardDeviation(X)
For those of you who do not have a strong background in Quants and Stats, I have tried to explain in simpler terms. Hope this helps!


March 29, 2016
[How To] Run a script to plot subplots in Octave
To demonstrate and perform POC's for some of the things that I learnt, I wrote a snippet of Octave script. The following is a very simple script to understand how to execute Octave script files and plot subplots.
Following are some of the things to keep in mind:
1. Octave scripts have a extension of ".m". ie. a script/function file named myScript has to be saved with "myScript.r"
2. We need to change the directrory to the path at which the script resides. We can use pwd,cd to perform this navigation.
3. In order to add any directory containing the script in Ocatve search path, we can perform the below operation.. After doing so, we can execute all the script files in the folder from any other folder.
eg:addpath(genpath("C:\Users\sesa398967\Documents\MyLearnings"));
The plot function in Octave is used to plot graphs on XY axis in Octave. Similarly subplotis an extention to plot function to plot further smaller graphs inside the same window.
Below is the octave snippet:
#declare a vector of 100 elements
a=[1:0.5:50];
#get a graph of 3*2 subplots and plot sin(a) function
subplot(3,2,1);
plot(sin(a));
title("Sin function for a");
legend("sin a");
#plot cos(a) function
subplot(3,2,2);
plot(cos(a));
title("Cos function for a");
legend("cos a");
#plot tan(a) function
subplot(3,2,3);
plot(tan(a));
title("Tan function for a");
legend("tan a");
#plot cot(a) function
subplot(3,2,4);
plot(cot(a));
title("Cot function for a");
legend("cot a");
#plot sec(a) function
subplot(3,2,5);
plot(sec(a));
title("Sec function for a");
legend("sec a");
#plot cot(a) function
subplot(3,2,6);
plot(csc(a));
title("Cosec function for a");
legend("cosec a");
#bye
How to run this script:
1. Save the above script to a text file with extension .m
eg.mysubplot.r
2. In the Ocatave terminal navigate to the directory in which the file resides.
3. Execute the script as by calling its name from the terminal.
eg: >> mysubplot
Output of the subplot script:
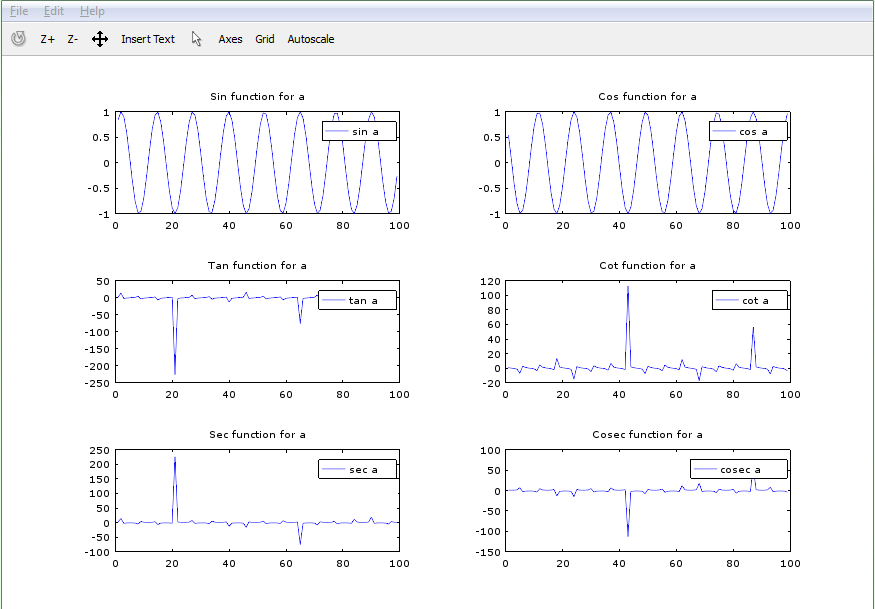 subplot function in Ocatve - www.ivishal.me
[click on the image to enlarge]

[How To] Run a script to plot a subplots in Octave
To demonstrate and perform POC's for some of the things that I learnt, I wrote a snippet of Octave script. The following is a very simple script to understand how to execute Octave script files and plot subplots.
Following are some of the things to keep in mind:
1. Octave scripts have a extension of ".m". ie. a script/function file named myScript has to be saved with "myScript.r"
2. We need to change the directrory to the path at which the script resides. We can use pwd,cd to perform this navigation.
3. In order to add any directory containing the script in Ocatve search path, we can perform the below operation.. After doing so, we can execute all the script files in the folder from any other folder.
eg:addpath(genpath("C:\Users\sesa398967\Documents\MyLearnings"));
The plot function in Octave is used to plot graphs on XY axis in Octave. Similarly subplotis an extention to plot function to plot further smaller graphs inside the same window.
Below is the octave snippet:
#declare a vector of 100 elements
a=[1:0.5:50];
#get a graph of 3*2 subplots and plot sin(a) function
subplot(3,2,1);
plot(sin(a));
title("Sin function for a");
legend("sin a");
#plot cos(a) function
subplot(3,2,2);
plot(cos(a));
title("Cos function for a");
legend("cos a");
#plot tan(a) function
subplot(3,2,3);
plot(tan(a));
title("Tan function for a");
legend("tan a");
#plot cot(a) function
subplot(3,2,4);
plot(cot(a));
title("Cot function for a");
legend("cot a");
#plot sec(a) function
subplot(3,2,5);
plot(sec(a));
title("Sec function for a");
legend("sec a");
#plot cot(a) function
subplot(3,2,6);
plot(csc(a));
title("Cosec function for a");
legend("cosec a");
#bye
How to run this script:
1. Save the above script to a text file with extension .m
eg.mysubplot.r
2. In the Ocatave terminal navigate to the directory in which the file resides.
3. Execute the script as by calling its name from the terminal.
eg: >> mysubplot
Output of the subplot script:
subplot function in Ocatve - www.ivishal.me
February 23, 2016
[Unix] Command to create directory only if it does not exist
The -p option with mkdir can be used to determine if the directory is already present and create it if it does not exist.
$ mkdir -p /home/demo /sub2/Test
The -p flag creates the /home, /home/demo, and /home/demo/sub2 directories
if they do not already exist.
However, if the directories already exists, the command does nothing.

January 4, 2016
[How To] How to count the number of coulumns in each row in a text file
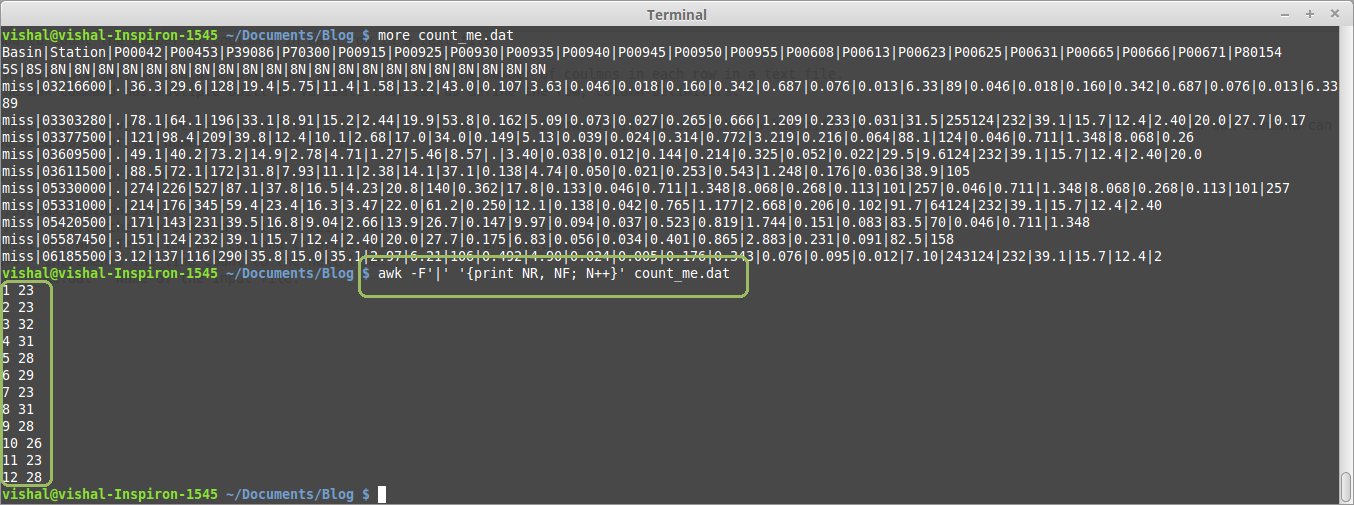
Supposing we have a pipe separated file called 'count_me.dat' with 12 rows in it. Also, each row has different number of columns. In such a case, below awk command can be used to count the number of columns in each file.
$ awk -F'|' '{print NR,NF; N++}' count_me.dat
::Syntax Explanation::
-F'|' - Tells the awk command that the field separator for the file is '|', pipe.
print NR, NF - Tells the awk command to print the row number and field number.
N++ - Increments the line count to the next line.
count_me.dat - Name of the input file.
::Sample Screen-shot::
 awk command to count the number of columns in each row [click on the image to enlarge]
January 3, 2016
[How To] Delete all but some files in UNIX
The below tutorial explains how to delete all files except the files that have a certain text in their file name.
::syntax::
$ rm !(*pattern_to_exclude*)
The above rm command tells the shell to delete all the files in the current directory except the files that match the pattern inside the parenthesis. The '!' acts as a negation operator.
The below screen-shot illustrates the same. It deletes all the files in the current directory except for the files that contain the string "Dont" in the filename.
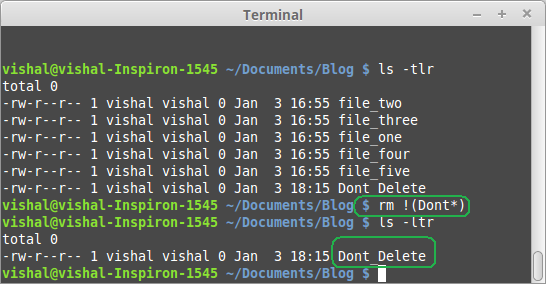 remove / delete all files except a few [click on the image to enlarge]
[How To] Unix command to replace all spaces in file names with underscore
Below syntax tells the shell to substitute all spaces (' ') in the name of all the files in current directory with underscore ('_').
::syntax::
$ rename 's/ /_/' *
The below snapshot from the terminal illustrates the same.
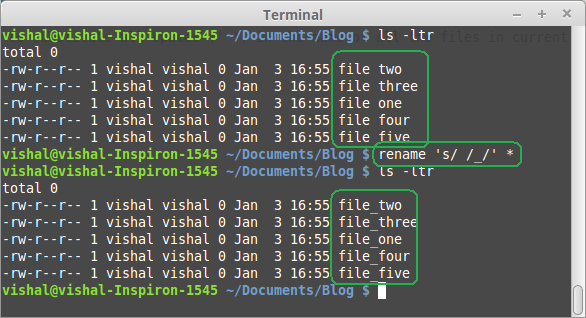 rename command to replace spaces with underscores [click on the image to enlarge]
[How To] UNIX one-liner to rename all files with a particular string in file name
We can use rename command to rename only the file names that contain a particular string to new filename.
::syntax::
$ rename 's/old_filename/new_filename/' *
::explanation::
s stands for substitute.
oldfilename is the text to find in the name of the file
new_filename is the text to be replaced
* denotes all files in the current directory structure
Below is a snapshot of the terminal which explains rename command.
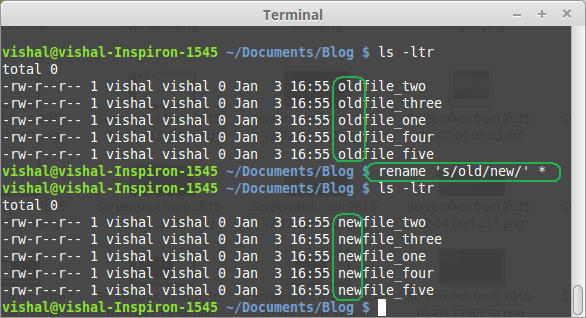 rename command [click on the image to enlarge]
[How To] Access ASCII table from UNIX command line
The ASCII table represents the corresponding Octal, Decimal, hexadecimal and Character values.
The ASCII standard was published by the United States of America Standards Institute (USASI) in 1968.
The following command can be used to view the ASCII chart while on command line.
$ man ascii
The following snapshot shows a sample output from 'man ascii' command.
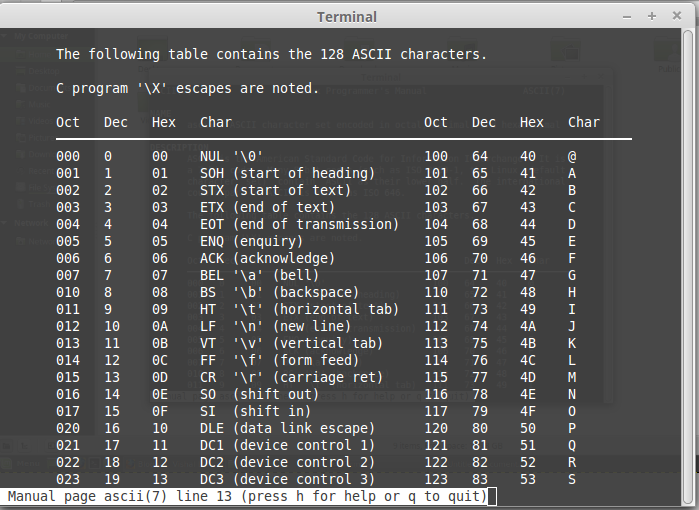 man ascii [click on the image to enlarge]
December 30, 2015
Tubes - Alan Watts
Below is an excerpt from a book that I am currently reading..
For there is a growing apprehension that existence is a rat-race in a trap: living organisms, including people,are merely tubes which put things in at one end and let them out at the other, which both keeps them doing it and in the long run wears them out.
So to keep the farce going, the tubes find ways of making new tubes, which also put things in at one end and let them out at the other. At the input end they even develop ganglia of nerves called brains, with eyes and ears, so that they can more easily scrounge around for things to swallow. As and when they get enough to eat, they use up their surplus energy by wiggling in complicated patterns, making all sorts of noises by blowing air in and out of the input hole, and gathering together in groups to fight with other groups.
In time, the tubes grow such an abundance of attached appliances that they are hardly recognizable as mere tubes, and they manage to do this in a staggering variety of forms. There is a vague rule not to eat tubes of your own form, but in general there is serious competition as to who is going to be the top type of tube.
All this seems marvelously futile, and yet, when you begin to think about it, it begins to be more marvelous than futile. Indeed, it seems extremely odd.
- Alan W. Watts in The Book: On Taboo Against Knowing Who You Are