
Metin Bektas's Blog: Metin's Media and Math - Posts Tagged "statistics"
Simpson’s Paradox And Gender Discrimination
One sunny day we arrive at work in the university administration to find a lot of aggressive emails in our in‒box. Just the day before, a news story about gender discrimination in academia was published in a popular local newspaper which included data from our university. The emails are a result of that. Female readers are outraged that men were accepted at the university at a higher rate, while male readers are angry that women were favored in each course the university offers. Somewhat puzzled, you take a look at the data to see what’s going on and who’s wrong.
The university only offers two courses: physics and sociology. In total, 1000 men and 1000 women applied. Here’s the breakdown:
Physics:
800 men applied ‒ 480 accepted (60 %)
100 women applied ‒ 80 accepted (80 %)
Sociology:
200 men applied ‒ 40 accepted (20 %)
900 women applied ‒ 360 accepted (40 %)
Seems like the male readers are right. In each course women were favored. But why the outrage by female readers? Maybe they focused more on the following piece of data. Let’s count how many men and women were accepted overall.
Overall:
1000 men applied ‒ 520 accepted (52 %)
1000 women applied ‒ 440 accepted (44 %)
Wait, what? How did that happen? Suddenly the situation seems reversed. What looked like a clear case of discrimination of male students turned into a case of discrimination of female students by simple addition. How can that be explained?
The paradoxical situation is caused by the different capacities of the two departments as well as the student’s overall preferences. While the physics department, the top choice of male students, could accept 560 students, the smaller sociology department, the top choice of female students, could only take on 400 students. So a higher acceptance rate of male students is to be expected even if women are slightly favored in each course.
While this might seem to you like an overly artificial example to demonstrate an obscure statistical phenomenon, I’m sure the University of California (Berkeley) would beg to differ. It was sued in 1973 for bias against women on the basis of these admission rates:
8442 men applied ‒ 3715 accepted (44 %)
4321 women applied ‒ 1512 accepted (35 %)
A further analysis of the data however showed that women were favored in almost all departments ‒ Simpson’s paradox at work. The paradox also appeared (and keeps on appearing) in clinical trials. A certain treatment might be favored in individual groups, but still prove to be inferior in the aggregate data.


How Statistics Turned a Harmless Nurse Into a Vicious Killer
Let’s do a thought experiment. Suppose you have 2 million coins at hand and a machine that will flip them all at the same time. After twenty flips, you evaluate and you come across one particular coin that showed heads twenty times in a row. Suspicious? Alarming? Is there something wrong with this coin? Let’s dig deeper. How likely is it that a coin shows heads twenty times in a row? Luckily, that’s not so hard to compute. For each flip there’s a 0.5 probability that the coin shows heads and the chance of seeing this twenty times in a row is just 0.5^20 = 0.000001 (rounded). So the odds of this happening are incredibly low. Indeed we stumbled across a very suspicious coin. Deep down I always knew there was something up with this coin. He just had this “crazy flip”, you know what I mean? Guilty as charged and end of story.
Not quite, you say? You are right. After all, we flipped 2 million coins. If the odds of twenty heads in a row are 0.000001, we should expect 0.000001 * 2,000,000 = 2 coins to show this unlikely string. It would be much more surprising not to find this string among the large number of trials. Suddenly, the coin with the supposedly “crazy flip” doesn’t seem so guilty anymore.
What’s the point of all this? Recently, I came across the case of Lucia De Berk, a dutch nurse who was accused of murdering patients in 2003. Over the course of one year, seven of her patients had died and a “sharp” medical expert concluded that there was only a 1 in 342 million chance of this happening. This number and some other pieces of “evidence” (among them, her “odd” diary entries and her “obsession” with Tarot cards) led the court in The Hague to conclude that she must be guilty as charged, end of story.
Not quite, you say? You are right. In 2010 came the not guilty verdict. Turns out (funny story), she never commited any murder, she was just a harmless nurse that was transformed into vicious killer by faulty statistics. Let’s go back to the thought experiment for a moment, imperfect for this case though it may be. Imagine that each coin represents a nurse and each flip a month of duty. It is estimated that there are around 300,000 hospitals worldwide, so we are talking about a lot of nurses/coins doing a lot of work/flips. Should we become suspicious when seeing a string of several deaths for a particular nurse? No, of course not. By pure chance, this will occur. It would be much more surprising not to find a nurse with a “suspicious” string of deaths among this large number of nurses. Focusing in on one nurse only blurs the big picture.
And, leaving statistics behind, the case also goes to show that you can always find something “odd” about a person if you want to. Faced with new information, even if not reliable, you interpret the present and past behavior in a “new light”. The “odd” diary entries, the “obsession” with Tarot cards ... weren’t the signs always there?
Be careful to judge. Benjamin Franklin once said he should consider himself lucky if he’s right 50 % of the time. And that’s a genius talking, so I don’t even want to know my stats.
World Population – Is Mankind’s Explosive Growth Ending?
According to the World Population Clock there are currently about 7.191 billion people alive. This year there have been 118 million births (or 264 per minute) and 49 million deaths (or 110 per minute), resulting in a net growth of 69 million people. Where will this end? Nobody can say for sure. But what we can be certain about is that the explosive growth has been slowing down for the past 40 years. I’ll let the graphs tell the story.
Here is how the world population has developed since the year 1700. The numbers come from the United Nations Department of Economic and Social Affairs. From looking at the graph, no slowdown is visible:

However, another graph reveals that there’s more to the story. I had the computer calculate the percentage changes from one decade to the next. From 1960 to 1970 the world population grew by 22 %. This was the peak so far. After that, the growth rate continuously declined. The percentage change from 2000 to 2010 was “only” 12 %.
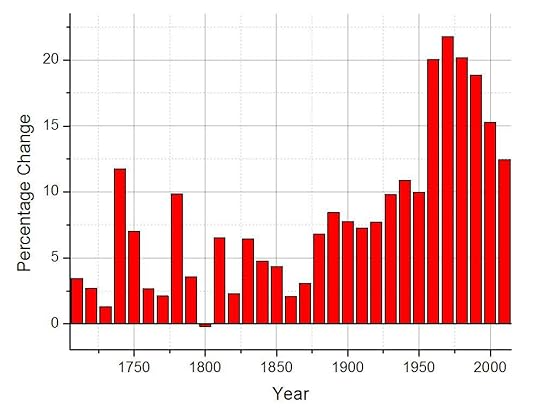
Of course it’s too early to conclude that this is the end of mankind’s explosive growth. There have been longer periods of slowing growth before (see around 1750 and 1850). But the data does raise this question.
Talk to me again when it’s 2020 or 2030.
Just by the way: according to estimates, about 108 billion people have been born since the beginning of mankind (see here). This implies that about 101 billion people have died so far and that of all those born, 6.5 % percent are alive today.
Did somebody say dust in the wind?
Here is how the world population has developed since the year 1700. The numbers come from the United Nations Department of Economic and Social Affairs. From looking at the graph, no slowdown is visible:
However, another graph reveals that there’s more to the story. I had the computer calculate the percentage changes from one decade to the next. From 1960 to 1970 the world population grew by 22 %. This was the peak so far. After that, the growth rate continuously declined. The percentage change from 2000 to 2010 was “only” 12 %.
Of course it’s too early to conclude that this is the end of mankind’s explosive growth. There have been longer periods of slowing growth before (see around 1750 and 1850). But the data does raise this question.
Talk to me again when it’s 2020 or 2030.
Just by the way: according to estimates, about 108 billion people have been born since the beginning of mankind (see here). This implies that about 101 billion people have died so far and that of all those born, 6.5 % percent are alive today.
Did somebody say dust in the wind?


