Cosmo P. DeStefano's Blog, page 4
August 25, 2023
Interest: The Reward and Risk of Time
Few concepts are as fundamental and powerful as interest. Widely recognized as the bedrock of economic growth and wealth accumulation, interest is a force that shapes our financial decisions and long-term prospects. At its core, interest embodies the paradox of being a reward and a risk—a duality that underscores its significance.
Why is understanding interest so important?
Interest serves a fundamental purpose in the world economy. It provides capital to those borrowing money while generating income for the savers who lend the money. As such, interest is both the reward for saving and the cost of borrowing. This dichotomy works to discourage investors and lenders alike from taking excessive risks.
In 1898, Swedish economist Knut Wicksell introduced the concept of the “natural interest rate” (subsequently referred to as the “neutral rate”). It is a rate that balances the supply of savings with the demand for investment. When the actual rate aligns with the neutral rate, economic stability prevails: neither slowing nor accelerating the economy. Deviations from this equilibrium, however, can lead to disruptions such as an overheated economy or sluggish growth.
The balancing act
Interest works as a balancing scale: the give and take; the yin and yang of the financial markets.
On one side of the scale, we have the concept of reward—interest as the "give." This is the side where time's magic unfolds, compounding wealth. As money is invested and nurtured over time, compound interest creates a snowball effect of accumulating wealth.
On the other side of the scale, we have the notion of risk—interest as the "take." This is the side that reminds us of the dynamic nature of financial markets and the unpredictability of the future. Investments can rise and fall, economic conditions can shift, and compounding interest expense can significantly increase an asset’s cost.
A key economic driver
The give-and-take dynamic of interest extends beyond individuals to the broader financial ecosystem. Central banks regulate interest rates to influence economic activity, balancing borrowing costs and inflation. This macroeconomic give-and-take can impact consumers' financial choices, shaping our ability to save, invest, or spend.
Just like the balancing forces of yin and yang seek equilibrium, interest strives to find its balance between these two sides.
The problem is that the neutral interest rate cannot be observed and pinpointed directly. Rather policymakers and economists infer the rate with hindsight and by watching and modeling current economic activity.
When this delicate balance gets out of kilter, when interest rates are set too low or too high, rational behavior can falter (and irrational behavior can grow exponentially).
Remembering the Global Financial Crisis
The concept is intuitively simple. But financial markets are anything but simple. Recall the global financial crisis of 2008-09. Lenders were loaning money indiscriminately; borrowers’ appetite for highly leveraged risky assets was insatiable; and investors had lost sight of the fact that failure was an option. Then the bottom fell out of the real estate market dragging the stock market down with it.
The Federal Reserve along with central banks around the globe responded by dropping interest rates to near zero. Savers were punished (earning nothing on their savings) in favor of borrowers who began grabbing low-cost debt by the bucket load.
Depressing the interest rate is a powerful tool to fend off a recession, but it can also have profound knock-on effects.
Savers had little choice but to abandon traditional fixed income assets in search of higher returns in more aggressive assets (e.g., stocks, real estate, alternative investments). Liquidity and ‘cheap’ leverage have fueled the financial markets since the crisis, pushing asset valuations higher for more than a decade.
When asset prices are rising, people and companies feel emboldened to borrow to support spending and investing. Strong equity markets can make the temptation to take on more leverage irresistible. Wall Street loves to use other people’s money and likes to pay as little as possible for the privilege.
Where do we stand now?
Year to date the S&P 500 Index is up 16% while the tech-heavy Nasdaq Composite has soared 28%. That is the best start to a year since 1997.
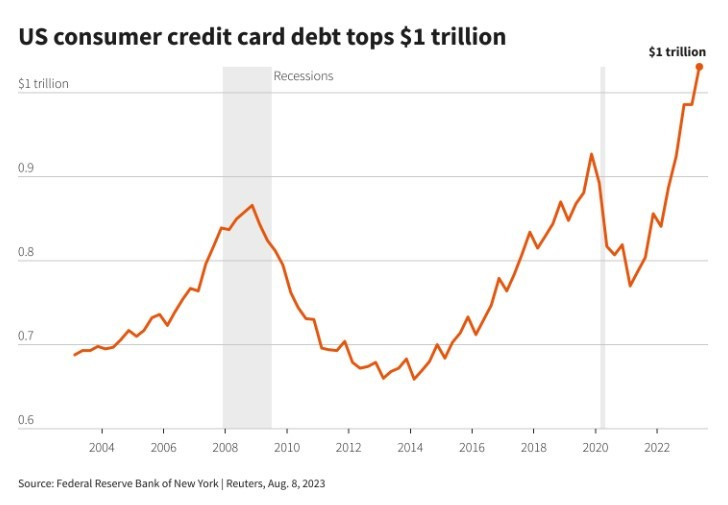
In the second quarter of 2023, US credit card debt surpassed $1 trillion for the first time ever while at the same time, average interest rates on those cards are again reaching historic highs of around 21%.
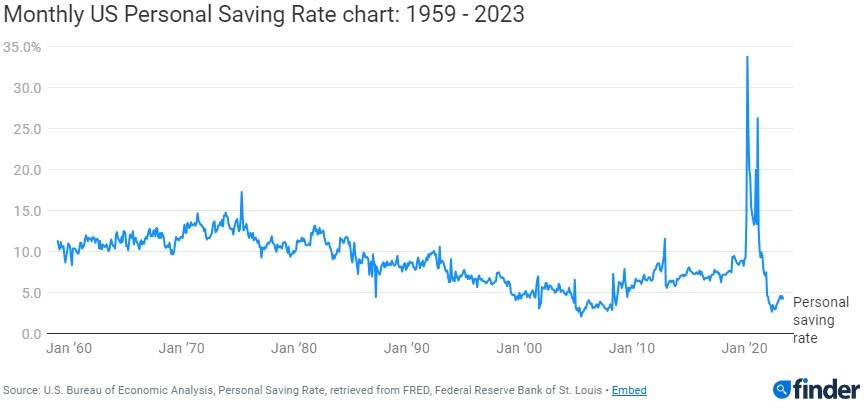
When we look at the flip side of the spending coin, the personal savings rate (which since 1960 has averaged 8.8% of disposable income) is getting close to an all-time low. For the 12 months ended June 2023, the saving rate was 3.8%, less than half the long-term average.
The Fed has its finger on the scale
Now, after 15 years of historically low interest rates, we find ourselves amid a dramatically shifting financial backdrop. Since March 2022 the Fed has been raising interests from near zero to more than 5% today.
Fixed income returns have been steadily rising. Money market funds are delivering 5% or more—yield levels not seen since 2007. Inflation has come down from its peak but remains stubbornly high. Home mortgage rates have returned to pre-financial crisis levels.
After a sharp decline in 2022, stock valuations have rebounded strongly. As of the closing bell on August 23rd, the S&P 500's Shiller P/E ratio was 30.6. Not only is this well above its average reading of 17 going back to 1872, but it marks only the fifth time in the last 25 years that the Shiller P/E has exceeded 30 during a rising market. The previous four instances where the Shiller P/E ratio surpassed 30 eventually led to declines of at least 20%.
Standing on a razor’s edge
"Eventually," however, can be a long time coming. I don’t pretend to know the short-term direction of the stock market, but the combination of high yielding fixed income, more expensive leverage, and elevated asset valuations implies to me that we could be in for a bumpy ride. Buckle up and stick to your long-term financial plan.
By embracing both sides of the interest scale and appreciating the delicate balance they create, we can learn to make better informed decisions and keep our footing as the financial landscape shifts beneath us.
As the adage goes: Those who understand interest, earn it. Those who don’t, pay it.
As always, invest often and wisely.

The content is for informational purposes only. It is not intended to be nor should it be construed as legal, tax, investment, financial, or other advice. It is merely my own random thoughts.


August 4, 2023
Does Residential Real Estate Belong In Your Portfolio?
He is not a full man who does not own a piece of land. —Hebrew Proverb
One of my earliest recollections of a financial lesson happened when I was thirteen or fourteen years old. On a hot summer afternoon, a small group of adults were in the yard discussing the idea of buying a two-family house in the neighborhood and renting it out to earn some extra cash.
I was only half listening, but when ‘Mr. G’ (an old-school Italian grandfather whom we all admired) started to speak, even I took note. Mr. G knelt and scooped up a handful of dirt. He gently massaged the dusty soil and let it sift through his fingers. As he was doing this he looked back at the group and quietly declared in broken English, “They no makah no more.”
To this day, it remains one of my favorite lessons—not for the wisdom it imparted—but for the fallacy that is often inferred from this otherwise true statement.
Land is a finite resource. Generally, a commodity with a fixed supply coupled with high demand leads to an increase in price. Land, however, is not priced by the pound, or valued based on the volume of dirt per square foot. It derives its long-term value from its utility such as farmland, pasture, mining, and yes, urban uses including residential housing.
In other words, the value is not in the dirt, but in the productive use of the land. Mr. G was correct when he said they don’t make any more. But I wish he would have added this qualifier…so choose your investment wisely.
The real estate debate
I often find myself in conversations discussing the relative merits of investing in residential real estate versus public stocks. There are proponents on both sides with strong opinions.
I don’t know why, but some people see these two asset classes as almost mutually exclusive—one is better and the other is worse. For me, it’s simply an asset allocation choice and there is nothing inherently wrong with investing in either or both.
What I do find interesting, however, is the apparent disconnect between the ‘wealth-generating’ benefits of each and the level of personal effort required to achieve those benefits.
If you buy Apple stock, you are now a fractional owner in a global business. All the day-to-day problems, issues, and challenges that Apple faces are dealt with by CEO Tim Cook and his management team. If their supply chain bottlenecks or the plumbing backs up at their state-of-the-art headquarters in Cupertino, rest assured Tim Cook’s team won’t be reaching out to you to get it fixed. You are a passive owner of Apple.
When you buy the two-family rental property across town, Tim Cook and his team won’t be there to help you with a clogged toilet or a messy tenant. That is your responsibility. In addition to being the owner, you are the active manager of the business.
That is a simple distinction that you need to understand as you make this asset allocation choice. Beyond this threshold difference, what follows are some additional considerations for you as you look to deploy your hard-earned money into these income-producing assets.
Diversification
Diversification is the process of investing in different asset classes so a portfolio is not overly concentrated and reliant on a single source of income or appreciation. The two main elements of diversification: investing across asset classes (cash, bonds, stocks, real estate, commodities, alternative investments, etc.); and adding variety within an asset class.
If a stock investor owns 5 different technology companies, they achieved some level of diversification with the number of investments, but they are still concentrated in one asset class (stocks), and within the asset class, 100% dependent on the technology sector.
Similarly, owning 5 two-family houses in your town spreads some of your risk but you are still 100% dependent on real estate, and limited to one geographical region.
Professional money managers may overweight their favorites to capitalize on what (they think) they know, but even they still diversify to protect against what they don’t know. No professional has a portfolio consisting entirely of just their single highest conviction pick!
(For a more in-depth discussion on diversification, read Diversification – Don’t Miss Out On Your Only Free Lunch)
Leverage
If you buy a $100,000 asset with $20k cash and $80k debt and the asset value increases by 25% you can sell it for $125k pay off the debt of $80k and are left with $45k, more than double your original cash investment. This is the allure of leverage.
If, however, the asset value fell 25% and you sold, you would receive $75k which leaves you with less than nothing. You would need to come up with an additional $5k just to pay off the $80k debt. You lost 125% of your original $20k investment. This is the angst of leverage.
With stocks, you can borrow up to 50% of the purchase price but most investors, including Warren Buffett, think that is extremely risky. With residential real estate, investors can and almost always do, borrow 80%+ and believe it’s a shrewd move. Go figure.
Liquidity
Stocks are priced throughout the day and generally offer easy liquidity (i.e., the ability to buy/sell). Continuous pricing can make stock price volatility feel overwhelming.
Houses are priced much less frequently, potentially years between valuations for any particular property. They are significantly less liquid and can take weeks/months to buy or sell. This lack of liquidity and current pricing can lead an investor to conclude that house prices are more stable (by masking short-term volatility). Not seeing price volatility, however, does not mean it’s absent.
As long-term investors, we must balance the convenience and liquidity of stocks (which comes with large fluctuations in prices) with the relative ‘stability’ and illiquid nature of real estate (which comes with opaque prices).
Tangible vs intangible
Stocks are often viewed as intangible with little intrinsic value as opposed to the fractional company ownership that they actually represent.
A house has consistently been a solid asset that you can ‘touch and feel’. When the stock market is sinking and your portfolio is down 40%, a house can still provide a roof over your head (provided the mortgage is being paid!) This can give real estate investors a sense of longevity in a way that ‘intangible’ stocks may not.
Return on investment
When investors brag about their big investment wins, it’s usually shortened to something like: I bought it for $200,000 and sold it for $350,000. This short-hand profit calculation might be good enough with a stock sale, but for a multi-year real estate property, not likely.
Calculating real estate returns starts with the same basic inputs, original cost, and sale price. From there, however, the calculation gets more complicated with the need to factor in not only rental income but a litany of additional costs such as mortgage costs, depreciation, operating costs (repairs and maintenance), major renovations, insurance, real estate taxes, any management fees, etc. All these costs can be like a slowly dripping faucet—easy to ignore but pile up quickly.
Those abbreviated success stories also don’t usually cover your other landlord responsibilities of arranging mortgage financing, closing costs, finding tenants, dealing with periods of vacancy (i.e., no rent checks), tenant complaints, the occasional tenant phone call that a broken hot water tank flooded the basement; or a clogged toilet is backing up; or here in the Northeast, a frozen water pipe is leaking in the living room ceiling (all scenarios that as a landlord I have experienced first-hand).
Let me sum it up this way: As a landlord, in addition to collecting rent and hopefully selling years later for a ‘wonderful’ profit, you need to recognize that throughout the intervening years, you are responsible for dealing with the triple T’s of real estate: Tenants, Toilets, and Trash, and not ignoring their impact on your investment return—and on your psyche.
You are free to choose
I’m not opining on the relative merits of deploying capital into either asset class, but rather on the level of effort and responsibility involved in managing and monitoring each capital outlay.
When you buy stocks, you are a part owner in a business operated by someone else. When you buy individual properties, you are the owner and the operator of that business. You need to understand and appreciate the difference.
Public stocks and residential real estate are just two (of many) asset classes that can help you on your wealth accumulation journey, but neither is effortless, and both carry risks.
If you could only choose between (a) owning stock in any of the world’s companies; or (b) owning houses that the companies’ employees live in, which would you pick? How you answer this question might start to give you some insight into how each asset class fits into your personal portfolio.
Your actual choice is not binary, and there is no one-size-fits-all answer. The best asset allocation strategy is the one that works for you.
As always, invest often and wisely.

The content is for informational purposes only. It is not intended to be nor should it be construed as legal, tax, investment, financial, or other advice. It is merely my own random thoughts.

Wealth Your Way is available on Amazon
Thanks for reading Wealth Your Way Insights! Subscribe for free to receive new posts and support my work.
July 21, 2023
5 Investing Concepts That Are Counterintuitive
The greater your skill, the more luck matters
In any activity that involves both skill and luck, such as investing, as skill increases the vagaries of luck play an increasing role in the outcome. Financial author Michael Mauboussin describes this challenge as the Paradox of Skill.
It sounds counterintuitive, but it is explained this way: even if your skill is increasing, the skill of your competitors is likely also increasing (e.g., the average investor is a lot more skilled than they were decades ago). As everyone’s actions and performance become more consistent, luck becomes more and more important.
Think about a professional tournament poker player in a game with amateurs and later in a second game with other top-ranked professionals. Skill will help the professional win over the amateurs.
In the second game, since the skill level of all participants will be much closer to parity (all the professionals will know how to play each hand based on the odds), the actual cards dealt to them in any given hand (luck) will be of increasing consequence.
If you win on a large investment, in addition to patting yourself on the back for your investing prowess, recognize that luck also played a role. Over your investing lifetime, you will find there are no shortcuts. Growing your portfolio requires patience, discipline, and yes, luck.
Skill vs. Luck: Understand the difference and focus on what you can control. The amount of your monthly contributions and monthly withdrawals are two of the most important factors in your financial plan, and both are completely within your control. Bull and bear markets are luck of the draw.
See a stock’s price, but don’t be blind to its value
We all know you can pay too much, even for a “good” thing. But it’s also true that there are very few assets that are so terrible that they can’t become a good investment when bought at a cheap enough price. In this regard, there are no bad companies, only mispriced ones.
“Cheap” doesn’t mean low price in absolute terms. It means low price relative to value. To determine “cheap” you need to understand that value and price are two sides of the same coin. And you need to evaluate both sides before making an investment decision. Buying “cheap” is the most reliable way to grow your portfolio.
Apple’s stock price is currently trading around $195, near its all-time high. Is this expensive or cheap? That determination depends on what its value will be over the next 3-5 years, not its trading price today.
On the flip side, Howard Marks, co-founder of Oaktree Capital, launched his career by buying the bonds of companies that were near to, or in, bankruptcy. Oaktree made a fortune investing in this so-called “distressed debt”—at the right price.
When the market is down, you are eventually up
If you are in the saving and investing stage with your portfolio, which would you prefer to happen to stock market prices:
(a) Go up
(b) Go down
(c) Stay flat
It is better to invest in stocks when the market is falling, not when it’s rising. As Warren Buffett has repeatedly said, whether we’re talking about socks or stocks, you should like buying quality merchandise when it is marked down. This makes complete sense in theory but can be quite hard to follow when making actual investment decisions.
One of the best years in the stock market was 1933 when the country saw unemployment hit 25%. It obviously didn’t feel good at the time, but the few investors who had the conviction to invest during the Great Depression reaped the reward. The same was true of the dot-com crash in the early 2000s, the financial crisis of 2008, and the COVID-19 induced drop in 2020.
For long-term investors, severe market downturns have proven to be the best times to invest. When stocks are ‘on sale’ head into the market not out.
You will earn higher returns on the cash you (wisely) invest into depressed markets. You just won’t see the results until after the down market recovers.
Following market forecasts increases risk
Stock market forecasts should be ignored. One study found that over a 20-year period, the average expert is “roughly as accurate as a dart throwing monkey.” (For a deeper dive on this point, see here and here). I’ll summarize by saying this: Don't fool yourself into thinking that forecasters have special insight into the future direction of the stock market.
Market forecasters are seldom right and even less frequently wrong—but how can that be, you ask? When their prediction proves false, they have two options, admit they were wrong, or move the goalpost. Most choose the latter.
One of the best equity market investors, George Soros, once said – My system doesn’t work by making valid predictions. It works by allowing me to recognize when I am wrong.
Simply put, the future is unknown and unknowable. And not only are we unable to predict the future, evidently, we can't even agree on what happened in the past.
During the 2008 Financial Crisis, was the debt debacle a result of the Fed’s loose fiscal policies, blind faith in complex financial instruments, the government encouraging lending to low-income borrowers, or was it just another example of a manic frenzy?
I don’t know, and I’m not concerned with figuring it out. Similarly, every single stock price fluctuation does not need an explanation or prediction. Don’t get bogged down in the guessing game that is short-term forecasting. Play the long game.
The next time you want to follow a prediction, even one with a compelling argument, ask yourself what you stand to lose if the prognosticator is wrong.
Following a dubious forecast about an unknowable future doesn’t diminish risk, it adds risk.
You don’t need more than average intelligence
Some would go as far to say that high intelligence is actually your biggest handicap.
If brain power was the magic ingredient to successful investing, one might think that Nobel laureate college professors populate the Forbes 400 Richest Americans List.
Instead, a more than trivial number of the current/former Forbes 400 club includes college dropouts. Larry Ellison dropped out of the University of Chicago. Michael Dell dropped out of the University of Texas. Bill Gates and Mark Zuckerberg dropped out of Harvard. Sergey Brin, Larry Page and Elon Musk all dropped out of Stanford. Steve Jobs left Reed College after 6 months. Ralph Lauren, Lady Gaga, David Geffen—all non-college grads.
I am not advocating for less education. In fact, more education is generally better, but do recognize that high intelligence does not have mystical power in driving wealth accumulation. Having a plan, applying discipline, working hard, and controlling emotions are equally important. The goal of higher intelligence should be enlightenment, but if not used properly, it can instead lead to overconfidence.
That’s why successful investors think more like poker players than scholars. They play the hand they are dealt. If they are dealt a good hand they increase their bet. If they get a not-so-good hand, they fold. As they assess this play/fold decision, they know how to evaluate probabilities and keep their emotions in check.
Howard Marks once said that he is convinced that everything that is important in investing is counterintuitive, and everything that’s obvious is wrong.
When it comes to your own wealth accumulation journey, if your ideas seem intuitive, you may want to take a second look.
As always, invest often and wisely.

The content is for informational purposes only. It is not intended to be nor should it be construed as legal, tax, investment, financial, or other advice. It is merely my own random thoughts.

5 Investing Investing Concepts That Are Counterintuitive
The greater your skill, the more luck matters
In any activity that involves both skill and luck, such as investing, as skill increases the vagaries of luck play an increasing role in the outcome. Financial author Michael Mauboussin describes this challenge as the Paradox of Skill.
It sounds counterintuitive, but it is explained this way: even if your skill is increasing, the skill of your competitors is likely also increasing (e.g., the average investor is a lot more skilled than they were decades ago). As everyone’s actions and performance become more consistent, luck becomes more and more important.
Think about a professional tournament poker player in a game with amateurs and later in a second game with other top-ranked professionals. Skill will help the professional win over the amateurs.
In the second game, since the skill level of all participants will be much closer to parity (all the professionals will know how to play each hand based on the odds), the actual cards dealt to them in any given hand (luck) will be of increasing consequence.
If you win on a large investment, in addition to patting yourself on the back for your investing prowess, recognize that luck also played a role. Over your investing lifetime, you will find there are no shortcuts. Growing your portfolio requires patience, discipline, and yes, luck.
Skill vs. Luck: Understand the difference and focus on what you can control. The amount of your monthly contributions and monthly withdrawals are two of the most important factors in your financial plan, and both are completely within your control. Bull and bear markets are luck of the draw.
See a stock’s price, but don’t be blind to its value
We all know you can pay too much, even for a “good” thing. But it’s also true that there are very few assets that are so terrible that they can’t become a good investment when bought at a cheap enough price. In this regard, there are no bad companies, only mispriced ones.
“Cheap” doesn’t mean low price in absolute terms. It means low price relative to value. To determine “cheap” you need to understand that value and price are two sides of the same coin. And you need to evaluate both sides before making an investment decision. Buying “cheap” is the most reliable way to grow your portfolio.
Apple’s stock price is currently trading around $195, near its all-time high. Is this expensive or cheap? That determination depends on what its value will be over the next 3-5 years, not its trading price today.
On the flip side, Howard Marks, co-founder of Oaktree Capital, launched his career by buying the bonds of companies that were near to, or in, bankruptcy. Oaktree made a fortune investing in this so-called “distressed debt”—at the right price.
When the market is down, you are eventually up
If you are in the saving and investing stage with your portfolio, which would you prefer to happen to stock market prices:
(a) Go up
(b) Go down
(c) Stay flat
It is better to invest in stocks when the market is falling, not when it’s rising. As Warren Buffett has repeatedly said, whether we’re talking about socks or stocks, you should like buying quality merchandise when it is marked down. This makes complete sense in theory but can be quite hard to follow when making actual investment decisions.
One of the best years in the stock market was 1933 when the country saw unemployment hit 25%. It obviously didn’t feel good at the time, but the few investors who had the conviction to invest during the Great Depression reaped the reward. The same was true of the dot-com crash in the early 2000s, the financial crisis of 2008, and the COVID-19 induced drop in 2020.
For long-term investors, severe market downturns have proven to be the best times to invest. When stocks are ‘on sale’ head into the market not out.
You will earn higher returns on the cash you (wisely) invest into depressed markets. You just won’t see the results until after the down market recovers.
Following market forecasts increases risk
Stock market forecasts should be ignored. One study found that over a 20-year period, the average expert is “roughly as accurate as a dart throwing monkey.” (For a deeper dive on this point, see here and here). I’ll summarize by saying this: Don't fool yourself into thinking that forecasters have special insight into the future direction of the stock market.
Market forecasters are seldom right and even less frequently wrong—but how can that be, you ask? When their prediction proves false, they have two options, admit they were wrong, or move the goalpost. Most choose the latter.
One of the best equity market investors, George Soros, once said – My system doesn’t work by making valid predictions. It works by allowing me to recognize when I am wrong.
Simply put, the future is unknown and unknowable. And not only are we unable to predict the future, evidently, we can't even agree on what happened in the past.
During the 2008 Financial Crisis, was the debt debacle a result of the Fed’s loose fiscal policies, blind faith in complex financial instruments, the government encouraging lending to low-income borrowers, or was it just another example of a manic frenzy?
I don’t know, and I’m not concerned with figuring it out. Similarly, every single stock price fluctuation does not need an explanation or prediction. Don’t get bogged down in the guessing game that is short-term forecasting. Play the long game.
The next time you want to follow a prediction, even one with a compelling argument, ask yourself what you stand to lose if the prognosticator is wrong.
Following a dubious forecast about an unknowable future doesn’t diminish risk, it adds risk.
You don’t need more than average intelligence
Some would go as far to say that high intelligence is actually your biggest handicap.
If brain power was the magic ingredient to successful investing, one might think that Nobel laureate college professors populate the Forbes 400 Richest Americans List.
Instead, a more than trivial number of the current/former Forbes 400 club includes college dropouts. Larry Ellison dropped out of the University of Chicago. Michael Dell dropped out of the University of Texas. Bill Gates and Mark Zuckerberg dropped out of Harvard. Sergey Brin, Larry Page and Elon Musk all dropped out of Stanford. Steve Jobs left Reed College after 6 months. Ralph Lauren, Lady Gaga, David Geffen—all non-college grads.
I am not advocating for less education. In fact, more education is generally better, but do recognize that high intelligence does not have mystical power in driving wealth accumulation. Having a plan, applying discipline, working hard, and controlling emotions are equally important. The goal of higher intelligence should be enlightenment, but if not used properly, it can instead lead to overconfidence.
That’s why successful investors think more like poker players than scholars. They play the hand they are dealt. If they are dealt a good hand they increase their bet. If they get a not-so-good hand, they fold. As they assess this play/fold decision, they know how to evaluate probabilities and keep their emotions in check.
Howard Marks once said that he is convinced that everything that is important in investing is counterintuitive, and everything that’s obvious is wrong.
When it comes to your own wealth accumulation journey, if your ideas seem intuitive, you may want to take a second look.
As always, invest often and wisely.
The content is for informational purposes only. It is not intended to be nor should it be construed as legal, tax, investment, financial, or other advice. It is merely my own random thoughts.
June 23, 2023
Rethinking Fixed Income with Dividends
Against the backdrop of recent bank failures, stubbornly high inflation, and uncertainty around future interest rates, traditional fixed-income investments such as bank accounts, CDs, and government bonds, aren’t providing investors with the same level of comfort they once did.
Maybe it’s time to refresh our thinking about where to invest a “fixed-income” allocation within a Financial Independence (FI) portfolio.
Let’s start with why we invest in fixed-income investments in the first place. Generally, for three reasons:
· #1- stable and predictable cash flow (e.g., interest income),
· #2- the relative safety of our capital, and
· #3- a need in our overall FI plan.
If traditional fixed-income investments are part of your plan and your cash is coming up short, dividends might help fill the gap.
You can’t avoid risk, but you can manage it
Before we move forward, a quick refresher on “risk” which we explored in One Definition of Risk for All of Us. We don’t look at short-term price volatility to measure risk but rather we define our risk in more practical, personal terms: Our principal risk is falling short of our cash spending goals.
As a result, in the short-term, we want to rely as little as possible on the sale of stocks to cover cash flow needs. As we all know, there is nothing ‘safe’ about being forced to sell stock to generate cash when the markets are falling.
So, what if you don’t need to sell stocks in the short-term and are comfortable with their long-term prospects? Well, price volatility becomes much less concerning and the cash dividends that stock funds generate can now move into primary focus.
Do you know the only thing that gives me pleasure? It’s to see my dividends coming in. - - John D. Rockefeller
My overarching theme here is cash flow yield and capital preservation. I'm willing to sacrifice stretching for price appreciation in this component of my FI portfolio. That is, we can think of a quality dividend fund (held long-term) more as a "bond-like" investment vs. pure equity play.
This view is somewhat analogous to a real estate investor owning an apartment building. Collecting the monthly rent checks is what matters. Daily changes in the fair market value of the building are of no consequence to the long-term investor.
Interest and dividends working in tandem
As background, here is a high-level view of just a few income opportunities along the yield spectrum:
· National average yield for bank savings accounts is currently around 0.4%.
· If you are willing to venture out to smaller online banks, high-yield savings accounts might get you upwards of 4-5%.
· S&P 500 passive index ETFs are currently yielding around 1.5%, with expense ratios generally less than 0.10%.
· Actively managed ETFs that are diversified and dividend-focused have a yield range of 2%-6%+ with expense ratios generally below 1%. (At the low end of this yield range you’ll find bond funds and moving up this range will be equity-focused ETFs).
· Closed-End Funds (CEFs) and Business Development Companies (BDCs) again, broad-based, actively managed dividend-focused funds have yields ranging from 6-10%+ with average expense ratios generally higher than 1%. You can find both equity-focused or debt-focused funds (bonds or corporate debt; leveraged or unleveraged) to fit your personal preference.
As you move up the yield curve from traditional fixed-income investments to equity funds you also will get more volatility in market prices - - but again, do we care?
Price volatility is not a concern provided (a) we have no intention of selling our quality fund choices, (b) we are at minimal risk of being forced to sell in the short-term in order to generate cash, and (c) we can control our emotional response to inevitable market drops.
Just like the real estate investor, we are energetically focused on collecting the dividends while apathetic to the day-to-day price changes of the fund. Occasionally, we’ll have a dividend cut (or an empty apartment), but with perseverance and patience, things usually bounce back.
Successful investing is about owning businesses and reaping the huge rewards provided by the dividends and earnings growth of our nation’s – and, for that matter, the world’s – corporations. - - Jack Bogle
By no means are dividends guaranteed, but historically, dividends have been significantly less volatile than stock prices. Since World War II, there have been 11 bear markets defined by a 20% or greater drop in the S&P 500 Index (excluding the COVID-19 induced drop which has yet to completely play out).
In three of these bear markets, dividends increased. In seven of the remaining eight, the average peak-to-trough decline in dividends was just 3%. The one outlier is the 2008-09 financial crisis which saw the S&P 500 Index drop 57%. The dividend decline was 23%, less than half of the Index price drop, and in four years dividends recovered to their pre-crisis level.
[NOTE: Recognize that a fund’s yield is important, but it should not be the sole factor used to make your investment decision. For example, the Invesco S&P 500 High Dividend ETF is today yielding 4.4% by investing in, you guessed it, a subset of S&P 500 companies. The Global X SuperDividend ETF’s yield is a much juicier 15% with almost three-quarters of its capital invested in foreign issuers including several small Chinese companies I’ve never heard of. I’m not recommending one over the other, but simply pointing out that you still need to do your homework to make sure each potential steward of your money is a quality fund and a good fit for your plan and your temperament.]
As in the game of chess, see the whole board
Before you go off chasing higher yields, be sure to address reason #3 that we mentioned at the outset: What is the need in your plan that you are trying to fill? Always take a step back and view investment selection and asset allocation within the context of your entire financial plan.
If, for example, bank CDs are part of your plan, and you are meeting your overall cash needs, be happy. The fact that CDs (one sliver of your plan) are delivering less than inflation or less than the stock market is irrelevant.
There is no reason (from a mathematical perspective) to stretch for more yield when your plan doesn’t need it. Why jeopardize what you have and need to chase what you don’t have and don’t need? Remember, you are not investing to beat inflation, an arbitrary market benchmark, or your neighbor, but rather to meet your cash spending goals.
A thought experiment
Let’s assume a benevolent billionaire offered to give you more cash than you could possibly spend in your lifetime or even your children’s lifetime. Fantasize about what that number would be…now double it. That is your offer.
This pot of money comes with only one stipulation: you must keep any unspent cash in a bank vault earning nothing, zip, zilch. Which response is most aligned with your thinking: (a) ‘No thanks, a negative real return on my cash would be foolish,’ or (b) ‘Thank you and can I buy you dinner?!’
Don’t fail to see the whole board.
I am not advocating for replacing your entire fixed-income allocation with equities, but I am suggesting that well-diversified, high-quality dividend-focused funds are worth a look.
As always, invest often and wisely.

The content is for informational purposes only. It is not intended to be nor should it be construed as legal, tax, investment, financial, or other advice. It is merely my own random thoughts.

June 9, 2023
Is AI The New Dot-com Craze?
AI has been around in various forms for more than 50 years. Think language translators, facial recognition, Deep Blue (the chess-playing computer that beat world champion Garry Kasparov), autonomous cars, SIRI and Alexa, and everyone’s favorite: automated customer service phone lines!
Lately, the AI surf is up. Nvidia is the most recent company to capture the AI imagination of investors pushing its stock price up 160% since the first of the year. And Nvidia is not alone in trying to catch the wave.
On their most recent earnings calls, Meta, Alphabet, Microsoft, and Amazon mentioned "AI" a combined 168 times. More broadly, the technology-heavy Nasdaq Composite Index is having its best calendar year start since 1991.
Are we finally at the precipice of an AI revolution, driving leaps in innovation, exponential productivity growth, and if history is a guide, astronomical stock prices?
Since we can’t actually peer into the future, maybe we can get a sense of what might be ahead by looking back.
After all, one thing is for sure, human nature is remarkably consistent.
The dot-com bubble
The dot-com era saw a rapid rise in technology stock valuations that drove the bull market during the 1990s. It was fueled by entrepreneurs and speculators looking to capitalize on a burgeoning and relatively new technology, the internet.
In January 1992, the Nasdaq Composite Index was at a level of 580. In March 2000, it peaked at 5,100 an almost nine-fold increase of 879% in less than 9 years.
Throughout the 90s, internet companies were forming at a rapid pace and quickly selling shares through an Initial Public Offering (IPO). Stock prices were then bid up thanks to the excitement and promise that this new technology and industry appeared to deliver.
During 1999-2000, 892 companies had IPOs in the United States, a majority were technology-related. That’s an average of two new companies every single trading day for two straight years.
One of the earliest of the large internet companies was theGlobe.com (a nascent social media site that planned to make money from advertisers). Its IPO was on November 13, 1998, with the initial offering price set at $9 per share. On its first day of trading, the stock rocketed up 977% to $97 before pulling back and closing the day up ‘only’ 605% at $63.50.
Speculators didn’t seem to mind that although theGlobe.com had a plan to make money, it had no actual revenue. Within 13 months, however, the lack of underlying fundamentals finally caught the market’s attention and theGlobe.com shares fell from $97 to less than 10 cents.
Everyone loves a good story
Somewhere in the middle of all these IPOs, an investment banker quipped to me that it was good if a potential IPO company was not profitable and even better if it had zero revenue. That way, it couldn’t be evaluated on traditional fundamental benchmarks, such as earnings per share, revenue per share, etc., and consequently can be bestowed with a lofty ‘internet valuation.’
The promise of a ‘great idea’ and a compelling story, coupled with no underlying fundamentals was the road map to selling stock to the investing public at excessively high valuations and raising large amounts of capital for the company. It worked and the rush was on.
Anyone with an idea on the back of a cocktail napkin and a cool company name which usually included ‘.com’ could seemingly sell shares at will and grab money from eager speculators.
In short order we saw Flooz.com, Pets.com, DrugStore.com, Garden.com, Webvan.com, and eToys.com, to name just a few of the hundreds of companies that were born during the craze.
What’s in a name?
Apparently, a lot. A 2001 study by a group of Purdue University researchers found that 95 existing companies that rebranded by adding “.com”, “.net” or “internet” to their names, saw their share price increase by an average of 74% in the 10 days surrounding the announcement day. Ten of the companies had a core business that was not even internet related.
My personal favorite, Kozmo.com (no relation) didn’t even make it to its planned IPO. It was founded in 1998 and quickly raised $250 million from private investors (including $60 million from Amazon) on the promise of a one-hour internet-based delivery service for small purchases. Kozmo.com couldn’t deliver (pun intended). It burned through all its cash and closed up shop in early 2001, just three years after its founding.
What goes up…
Eventually, market participants remembered that trees don’t reach the sky and business fundamentals matter. A company cannot grow at an ever-accelerating rate, and its growth will not go on forever.
Not all dot-coms failed, but all took a hit as the bubble burst and the Nasdaq fell almost 80% over the ensuing two years to a low in October of 2002.
Those dot-coms that adapted, refocused on core business fundamentals, and delivered quality products and services not only survived but continue to thrive today (e.g., Amazon, eBay).
But for every company that managed to carry on, dozens of others like Kozmo.com and theGlobe.com imploded and filled the dot-com graveyard, wiping out some $5 trillion in market capitalization from the Nasdaq’s peak.
An interesting post-mortem
After the internet bubble bust of the early 2000s, companies were again similarly quick to change names—this time by dropping the dot-com moniker and the negative stigma it had come to convey.
A prime example: In 1998, Mecklermedia changed its name to Internet.com. Three years later, Internet.com became INTMedia Group with its CEO pointing out “It’s window dressing for the financial community.” On the news of this second name change, the company’s stock price jumped 54%.
Dot-ai has arrived
Our goal with better understanding the past is not to predict the future but to see the present with clear eyes. AI is a compelling storyline right now. And bold stories garner attention, attract money, and often, drive-up stock valuations indiscriminately.
Here is just a sample of the many companies that are hoping to cash in on the hot AI industry while also playing the latest iteration of the name game: Suki.ai, Pony.ai, Sherpa.ai, OpenAI, Swim.Ai, People.ai, Copy.ai, C3.ai, Iris.ai, PathAI, Viz.ai, Involve.ai, H2O.ai, Clarifai, AIBrain, and the clever, AEye.ai.
Being early isn’t always a good thing
AI may very well prove to be a “change the world” technological advancement whose time has come.
But investors need to remain mindful of company fundamentals, and cautious of blindly following a fluffy narrative and the crowd to dizzying heights. Like the transformative innovations that came before, not all companies or investors early to the party are the ones who achieve long-term gains.
Stock picking still entails the daunting task of identifying the select list of companies that will prosper with your investment—Kozmo.ai anyone?
As always, invest often and wisely.

The content is for informational purposes only. It is not intended to be nor should it be construed as legal, tax, investment, financial, or other advice. It is merely my own random thoughts.
Thanks for reading Wealth Your Way Insights! Subscribe for free to receive new posts and support my work.

May 28, 2023
The 4% Rule: How Reliable is It?
There are no shortcuts to anyplace worth going. —Beverly Sills
In our hectic lives, everyone likes a quick answer. How about this one: When you can live off 4% of your portfolio annually you are financially independent. Short and sweet. Seems like a simple enough shortcut to follow, but first, recognize it as such—a shortcut. And know this, when blindly accepted as golden rules, shortcuts can be dangerous to your financial and emotional well-being.
When planning for the withdrawal stage, several variables impact your plan: rate of return, number of years in the plan, asset allocation, sequence of returns, etc. Some of these variables are out of your control. The single largest variable, however, is likely the dollar amount of your annual withdrawals, and this variable is completely within your control. Hence the wide popularity of the 4% Rule.
If you look past the one-line of advice, however, most proponents of the 4% Rule will also point out that while it may be a valid starting point, it is not a set it and forget it strategy.
A progression of thinking
Let’s start with a holistic view of withdrawal strategies. My experience shows that there are four levels in the progression of thinking about your Financial Independence (FI) “number” and withdrawals from that portfolio:
Level One: Financial novices throw out numbers off the top of their heads without any real data to back them up. I’ve heard guesses at the presumed FI number in the range of $500,000 to $25 million. That’s a big range! And that range tells us nothing about how much a person could annually withdraw. Fun to banter around with friends, but not a lot of practical guidance at this level.
Level Two: Some advisors suggest that you use your pre-FI income to estimate your targeted FI spending needs. That is, multiply your salary by some factor (often 70%-85%) to estimate what you will need in annual FI cash flow. This implies that your spending is directly tied to your historical level of income. If you are living paycheck to paycheck, this estimate may be somewhat reliable. For diligent FI enthusiasts who annually save increasing amounts of their income, this method could significantly overstate FI cash flow needs.
Level Three: You gain more focus and clarity by estimating spending needs based on your projected future expenses rather than a percentage of historical income. You then take your annual cash flow need and multiply it by 25 to get to your targeted FI number (this is effectively getting at the 4% Rule discussed later).
Level Four: FI enthusiasts and advisors work past these “rules of thumb” and averages, and focus on projecting a personalized withdrawal dollar amount based on your spending needs. Resulting in a personal withdrawal rate that could be higher or lower than the shortcut average 4% rate.
You cannot get to 100% certainty of never running out of money (remember, no one can predict the future with complete accuracy), but these four levels coincide with increasing confidence levels. If you are the freewheeling fly by the seat of your pants type, pick a number at level one, and never worry about it again! Since you are reading this article, I would suggest you are already past level one and looking to refine your number and gain more confidence in your personal withdrawal strategy.
Origin of the 4% rule
This concept was first introduced by financial advisor, Bill Bengen in 1994. Mr. Bengen has been clear in pointing out that his research is based on a worst-case scenario using a very specific set of assumptions including a targeted asset allocation of 50% stocks and 50% intermediate-term US government bonds; historical market results; and a fixed 30-year retirement period.
In short, you withdraw 4% of your FI Portfolio in your initial year. In subsequent years, you increase the dollar amount of your withdrawal to account for inflation. In theory, by following this principle, you should have a high probability of your annual withdrawals lasting 30 years.
For example, let’s say you have $1 million in your FI Portfolio at the beginning of your withdrawal stage. In year one, you could withdraw $40,000. If inflation (i.e., the cost of living) rises 3% that year, then in year two, you withdraw $41,200 ($40,000 plus 3%) and so on for 30 years.
Over the years, however, the details have faded away and the concept has come to be known as the safe spending rate, or simply, the 4% Rule.
There is no one-size-fits-all
Twenty-five years after first publishing his findings, Bengen discussed the over-simplified interpretation of the ‘4% Rule’ that has found a wide audience. Bengen noted that 4% is based on empirical research but it’s not (and never has been) an unassailable truth. There is no one-size-fits-all and your personal withdrawal rate ‘could be anything.’
If you are early in your wealth accumulation stage with decades to go, being familiar with the “4% Rule” can give you a big picture view of a distant future. That is, for each $1 million in your FI Portfolio, you may be able to generate roughly $40,000 of annual cash flow. It’s a helpful shortcut but only for a very high-level estimation.
As the winds of change blow, put up a sail, not a wall
The point is, no amount of historical research and back-testing can give you an absolute withdrawal rate going forward. Rather than a rule or goalpost, use 4% as a guidepost in your financial planning and annual updates. Adjust for your personal circumstances, accordingly.
Below is a chart of the maximum sustainable withdrawal rates (based on Bengen’s research) prepared by Wade Pfau in 2018. As you can see, the so-called SAFEMAX (a term Bengen used to describe the highest sustainable withdrawal rate for the worst-case scenario in the time period covered) is approx. 4%.
 SAFEMAX: Maximum Sustainable Withdrawal Rates For 50/50 Asset Allocation, 30-Year Retirement, Inflation Adjustments Using SBBI Data, 1926–2017, S&P 500 and Intermediate-Term Government Bonds (Source: Forbes)
But look at the variability of results depending on the year of retirement. The range is approximately 4% for a retiree in 1966 to over 9% for a retiree in 1982.
So, rather than thinking of 4% as the target, think of it as being on the lower end of a range—a range of possible outcomes. With the use of probabilities, you can then calibrate your projections knowing that moving down towards 4% (or below) is conservative and moving above 4% is potentially aggressive but not out of the question.
Let 4% inform your plan, not be your plan
4% might work for the average person, but no one individual is the ‘average person.’ Everyone is unique; and while 4% might work in a hypothetical example with one set of specific variables, change one or more of those variables, and all bets are off. You need to assess your personal ‘safe’ withdrawal rate.
The key is to not have a rigid withdrawal plan, but a flexible and personalized strategy. For example, developing a plan that contemplates variable annual withdrawals providing flexibility to take less when market valuations are down (e.g., temporarily lowering your vacation spending, or dining out expenses), and to take more when valuations are higher.
Being flexible can increase the likelihood that your money will last as long as you do.
PCR: Plan, Course-correct, Repeat.
As always, invest often and wisely.

The content is for informational purposes only. It is not intended to be nor should it be construed as legal, tax, investment, financial, or other advice. It is merely my own random thoughts.
Thanks for reading Wealth Your Way Insights! Subscribe for free to receive new posts and support my work.

May 20, 2023
True Financial Freedom Is Having Enough
Life is a balance of holding on and letting go. —Rumi
As financial independence (FI) enthusiasts, we are diligently calculating and planning the dollars we need to meet our FI goals. But FI is about a lot more than just the math. While the numbers are extremely important, it’s just as critical to answer the question: Am I comfortable I have enough money? In addition to getting the math to work, you need to teach yourself to find inner peace with “enough” on an emotional and social level. Enough is true financial freedom.
More is never enough
I recently read an interview with Abigail Disney (granddaughter of Roy O. Disney, co-founder of the Walt Disney Company). In it, they reference a study performed by The Chronicle of Philanthropy which asked people who inherited money a simple question: ‘What amount of money would you need to feel totally secure?’ Regardless of the amount of money each had and inherited, every single person came up with an amount that was roughly twice what they inherited.
Money might not buy happiness but people expect, at a minimum, for money to get them far down the road. So how do you answer the question, ‘How much money is enough?’ Early in the accumulation stage, the answer is likely self-evident: ‘More than I have today.’
The fires of consumption
‘More’ is a lesson that we learn early on. More starts from early childhood and is one of the first math concepts understood by young children. And from a linguistics standpoint, it sure felt like my kids learned to say “more” right on the heels of learning “No!” (“Dad, can I borrow your car?” follows all too soon thereafter.)
Arguably, the desire for ‘more’ is innate, but it is unquestionably clear that we as a society have stoked the fires of consumption.
Early in the 20th century, the benefits of The Second Industrial Revolution had begun to curtail the need for a seemingly endless work week and provided workers with much-needed leisure time. As a result, there was considerable discussion and debate around the right balance of labor and leisure.
Up until that time, individuals worked and made purchases to satisfy their basic needs. Once those needs were met, these same people could spend less time working and enjoy their new-found leisure. Businesses, however, began to worry about slowing economic growth and a national state of overproduction and saturation.
In response to the perceived threats of chronic overproduction and the declining need to work, business leaders began to refocus not on production but on consumption. They concluded that consumption (i.e., demand) could be stimulated and nurtured—with a little help from the advertising industry.
Needs and wants
Advertising agencies (think Mad Men TV show), in effect, helped usher in the concept of raising one’s standard of living by buying not only what you need, but also what you want. And rather than individuals deciding on their own what they might want, businesses and advertisers would show them the way.
In 1929, U.S. President Hebert Hoover’s Committee on Recent Economic Changes issued a report noting the following:
“The Survey has proved conclusively what has long been held theoretically to be true, that wants are almost insatiable; that one want satisfied makes way for another. The conclusion is that economically we have a boundless field before us; that there are new wants which will make way endlessly for newer wants, as fast as they are satisfied.”
Leisure time came to be seen not as a threat to working but as a compelling reason to work. People would need to work more to pay for the additional consumption of things they didn’t previously know they wanted. And not expanding the forty-hour work week was good because “it promises more leisure to use up golf balls and holiday clothes.”
The age of consumerism and the accumulation of things was upon us.
An interesting paradox
All this consumption is good for the macro-economy: people spending money on goods and services. After all, personal consumption is a significant driver of large economies (e.g., personal spending is over 55% of gross domestic product in Canada, 63% in the UK, and 70% in the U.S.)
It’s just not a particularly good strategy for you as an individual on your FI wealth accumulation journey. If you spend all your earnings, you are helping to drive the economy but not growing your wealth.
What helps you is everyone else spending and driving the economy up while you save and invest in companies that benefit from that economic growth. It is an interesting paradox: personal vs. societal economics. I let one simple rule guide me through this paradox on my FI journey: spend a little, save a lot.
Is money the root of all evil?
We are currently living in a culture of more. People constantly looking for more: time, house, cars, vacations, sex, travel, and yes, money. Not that having more is bad, harmful, or immoral, but you do need to recognize that the desire to have more can be insatiable. It can become a vicious feedback loop—have some, want even more.
The Bible is often quoted as saying that money is the root of all evil. But what the Bible actually says is that “the love of money is the root of all evil.” (1 Timothy 6:10). Money is not an end, in and of itself, but a tool to be used on your FI journey. We don’t covet money, per se, but rather the freedom that money can offer us.
When it comes to your FI Portfolio, if you are not comfortable with your money being enough, the default solution will always be to seek out more. So, when does it end? When you mathematically have and are emotionally comfortable with, enough. At that point, you will have reached financial freedom, or as financial author Brian Portnoy likes to call it, “funded contentment.”
Enough is both eloquent and potent
When the famed author of the bestselling World War II novel Catch-22, Joseph Heller, passed away, his contemporary and friend, Kurt Vonnegut, penned a short tribute. It recounted the tale of the two of them attending a party on Shelter Island, NY hosted by a billionaire hedge fund manager. Kurt informed Joe that their host likely made more money in one day than Joe’s book had earned in all the years since it was published. Joe responded, “I’ve got something he can never have…enough.”
When the numbers add up and you have reached the pinnacle of financial freedom, make sure your emotions and feelings about money are not playing catch-up.
As always, invest often and wisely.

The content is for informational purposes only. It is not intended to be nor should it be construed as legal, tax, investment, financial, or other advice. It is merely my own random thoughts.
Thanks for reading Wealth Your Way Insights! Subscribe for free to receive new posts and support my work.

May 12, 2023
Inflation Is Simply One More Expense
Inflation is the parent of unemployment and the unseen robber of those who have saved. −Margaret Thatcher
We have all seen news stories explaining that in this inflationary environment cash is generating negative returns when adjusted for inflation. Cash is also generating negative returns when adjusted for my weekly grocery bill. Both are true statements so why the intense focus on the former?
The corrosive power of inflation is garnering a lot of headlines lately and is one of the most frequent reasons people cite for being concerned about meeting their current and future spending needs. Inflation is clearly a component of our financial planning, but only one of many moving parts. Let’s put inflation into perspective and hopefully relieve at least some of the angst.
What is inflation?
The US Bureau of Labor Statistics (BLS) reports Consumer Price Indices (CPI) which measure changes in the price level of the economy over a period of time. The CPI measures a basket of goods and services trying to represent a typical household’s spending on various common items such as food, clothing, housing, transportation, utilities, etc. Inflation is a general rise in these price levels. Simply put, ‘stuff’ will cost more in the future.
Real rate of return
As a result, economists and financial pundits talk about the loss of purchasing power and the need to consider the “real” rate of return (i.e., nominal investment return minus the inflation rate) when projecting growth of investments. As an example, if your investment return is 5% and inflation is 3%, the “real” rate of a return is 2%.
Economists use the real rate of return to help explain economic trends and their impact on global populations over time. I agree with this macroeconomic view of the world, but when it comes to personal financial planning, the “netting” of inflation with returns unnecessarily muddies the water.
When I have a future purchase to make and $100 in my pocket, I don’t think in terms of how much less the one-hundred-dollar bill will buy next year, but rather how much more the goods I seek might cost. Personal financial planning should follow this same intuitive thought process.
Avoid netting variables
While planning and projecting out cash withdrawals, I view inflation as simply another expense (one more retirement spending need) rather than a negative or “contra” rate of return. Rather than deflating your investment return, inflate your expenses.
For example, let's say you have projected to start withdrawals with a $2.5m portfolio, an expected nominal investment return of 5%, a long-term annual inflation estimate of 3%, and an annual spending goal of $100,000. If all assumptions prove correct, in year two your total spending needs would increase by your inflation rate, so you would need to withdraw $103,000; year three would be $106,090, and so on. See the chart below.
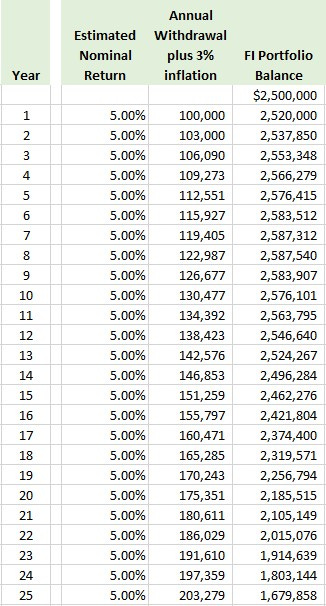
[NOTE: The current inflation rate is around 6%, but for multi-decade financial planning purposes, the long-term average rate might be closer to the historical average of 3-4%. Morningstar, for example, estimates the average inflation rate for the next 30 years at 3.8%.]
As you can see in the chart, by year 25, the 3% inflation has doubled your annual spending need from $100,000 to more than $200,000! That is the corrosive power of inflation that garners the headlines. But it is not the complete story.
Notice that with a 5% nominal return, your portfolio would generate more than enough to cover your spending for the entire 25-year period and beyond (including your inflated expenses). And just as importantly, the $1.67m balance in year 25 is the projected actual dollars in the portfolio, not a hypothetical inflation-adjusted balance.
Obviously, the above is a simplistic example of a multi-variable projection. Your results will vary (it’s called personal finance for a reason). The point is, as you dutifully go about your planning process, avoid netting variables whenever possible. Keeping gross expenses on one side of the ledger, and gross returns on the other is simpler, and simple beats out complex every time.
What, specifically, is inflated?
The BLS publishes monthly averages for 211 spending categories across 38 urban geographical areas and uses that data to calculate several variations of CPI that are used for different purposes. I, however, have far fewer spending categories and I live in just one urban area.
Inflation is individualized and each person feels inflation to different degrees. What really matters in our financial journey is your "personal inflation rate" or in other words, the annual increase in your total retirement spending. Financial author Jason Zweig likes to call it ‘meflation.’
Studies have shown that changes in retirement spending can vary dramatically among retirees, and while some expense categories increase, others eventually decrease. A national average inflation rate might be a starting point, but the actual increase (or decrease!) in your total spending needs is much more informative and of practical use, as you plan out your current spending and retirement withdrawal strategies.
Keep inflation in perspective
The sum of all your personal expense categories will add up to 100% of your spending needs. Long-term inflation, on average, has been approximately 3% of that total. The remaining 97% of your spending deserves equal billing, or just maybe, a little more of your attention.
‘Real’ returns are useful when evaluating macroeconomic trends across a large population, but when getting down to personal financial planning for a population of one, keep the process intuitive. Do not let inflation rob your plan of its simplicity.
As always, invest often and wisely.

The content is for informational purposes only. It is not intended to be nor should it be construed as legal, tax, investment, financial, or other advice. It is merely my own random thoughts.
Thanks for reading Wealth Your Way Insights! Subscribe for free to receive new posts and support my work.

April 28, 2023
One Definition of Risk for All of Us
The future is the worst thing about the present. —Gustave Flaubert
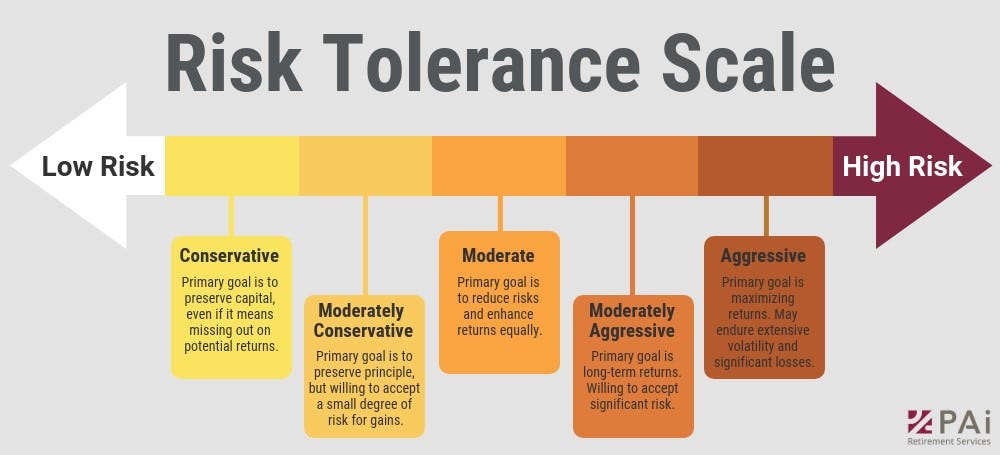
The traditional approach to assessing your investment risk tolerance would have you complete a questionnaire about your investing experience and your rational response to some hypothetical questions, many of which are based on volatility. Tally up your score and you find yourself plotted along a continuum that might look something like this 5-point scale:
The problem is, you may answer the questions on some random Saturday afternoon when the sun is shining and the stock market is closed. Now complete the questionnaire when the stock market has been falling for 5 straight days and the talk of recession is flashing all over the financial news...do you think you might vacillate over these same questions?
Calculating “risk” based on volatility is an interesting theoretical analysis, but ignoring fickle human emotions can provide an investor with a misleading and sometimes erroneous answer.
Modern Portfolio Theory
A lot of the investing concepts generally discussed for the wealth accumulation stage are grounded in Modern Portfolio Theory (MPT), which seeks to deliver the highest possible returns for the level of risk you are taking.
[NOTE: Harry Markowitz introduced the world to MPT in 1952 and his principles have influenced generations of financial thinking. In 1990, Markowitz shared the Nobel Prize in Economics for his efforts around MPT].
Finding this optimal balance of return and risk is what Markowitz describes as investing along the efficient frontier. MPT has been successfully used for decades by institutions such as endowments, pension plans, and large trust funds, etc. The traditional approach to retirement planning has taken the principles of MPT and adapted them to individual investors.
But here’s the rub: large institutions, like an endowment, have an infinite time horizon without an overall drawdown stage. Institutions are effectively in a perpetual accumulation mode. They do not need to plan for and manage through a significant and finite withdrawal stage, but you do.
If you want something you’ve never had, you must be willing to do something you’ve never done. —Thomas Jefferson
Enter: goals-based planning. With origins going back decades, goals-based planning gained in popularity after the 2008-09 financial crisis. It seeks to refocus our goals away from obtaining abstract market return rates, and towards meeting specific personal goals (e.g., our monthly spending needs).
As such, we should similarly reframe our risk profile, moving away from focusing on the volatility of market prices. Technical definitions of market risk include such terms as standard deviation, alpha, beta, R-squared, and Sharpe ratio (That’s a lot to digest). Alternatively, we can look at our plan and describe our risk in a simpler, more holistic way: our principal risk is the chance that we fall short of our spending goals.
Volatility is opportunity not risk
Volatility is not a good measure of risk for us because, on its own, it is simply a probability statistic. Volatility needs to be linked with a consequence to provide us a practical and useful measure of risk.
If a meteorologist says there is a 90% chance of rain tomorrow, it is a risk to you only if you plan to be outdoors. If you will be at home all day it will still likely rain, but your risk of getting wet goes to zero. Similarly, the fundamental risk in your portfolio is not asset prices moving around (volatility), but rather not having the cash, when you need it, to cover your expenses.
I generally don’t shy away from an investment because its price might be volatile, but I will stay away if I think there is a relatively high probability that I’ll permanently lose my money. For the long-term investor, volatility is more opportunity than risk. Volatility can provide opportunities to invest in assets at depressed prices. But remember to always evaluate the probability of a good investment outcome against the consequences of being wrong.
The true definition of risk
If an advisor says to you (or you tell yourself) that you failed to beat the market last year, your response should be, That’s an interesting factoid, but underperforming the market is not a risk I worry about. Much more importantly, Where am I relative to my goals? And do I need to course-correct?
A goals-based approach to planning can help make the risk more tangible. We take measured, personally defined risks, and don’t endlessly ponder esoteric volatility measures of risk. Goals-based planning is focused on optimizing a limited pool of financial assets, by matching assets and income with future liabilities and expenses (i.e., future spending needs).
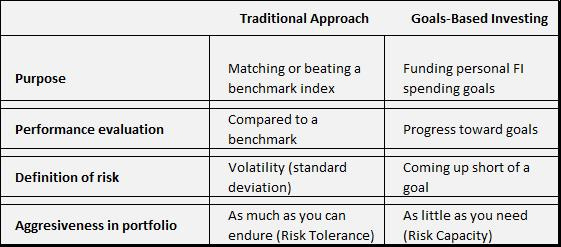
If, for example, you can meet all your cash flow needs with a 5% return, then why take on a greater risk of loss to try and achieve a higher return? Why risk losing what you have and need to chase what you don’t have and don’t need? Your goals, not your risk tolerance, should drive investing decisions. During the withdrawal stage, income and capital preservation become more important than stretching for out-sized returns.
With your focus on goals-based planning and making course-corrections to your dynamic financial plan, don’t take as much risk as you can tolerate; take as little risk as you need.
As always, invest often and wisely.

The content is for informational purposes only. It is not intended to be nor should it be construed as legal, tax, investment, financial, or other advice. It is merely my own random thoughts.
Thanks for reading Wealth Your Way Insights! Subscribe for free to receive new posts and support my work.