
Gennaro Cuofano's Blog, page 84
March 17, 2023
Ford Retail Sales

In 2022, Ford sold 955,543 trucks, 861,256 SUVs, and 47,655 cars in the US via retail.
Related Visual Stories Ford generated $158 billion in revenue in 2022, compared to over $136 billion in 2021, and over $127 billion in 2020.
  Ford posted a net loss of nearly $2 billion in 2022, compared to a net profit of almost $18 billion in 2021, and a net loss of over $1 billion in 2020.
  Compared to retail, Ford sold most of its cars via wholesale in 2022.
  In 2022, 52% of Ford’s vehicles (2 million) were sold via wholesale, vs. 48% sold via Retail (48%).
The post Ford Retail Sales appeared first on FourWeekMBA.


Ford Financials

Ford generated $158 billion in net revenue in 2022, compared to a net loss of nearly $2 billion in the same period, and over $136 billion in revenue in 2021, compared to a net profit of almost $18 billion in 2021.
Related Visual StoriesFord generated $158 billion in revenue in 2022, compared to over $136 billion in 2021, and over $127 billion in 2020. Ford posted a net loss of nearly $2 billion in 2022, compared to a net profit of almost $18 billion in 2021, and a net loss of over $1 billion in 2020. Compared to retail, Ford sold most of its cars via wholesale in 2022. In 2022, 52% of Ford’s vehicles (2 million) were sold via wholesale, vs. 48% sold via Retail (48%).The post Ford Financials appeared first on FourWeekMBA.
Ford Profitability

Ford posted a net loss of nearly $2 billion in 2022, compared to a net profit of almost $18 billion in 2021, and a net loss of over $1 billion in 2020.
Related Visual StoriesFord generated $158 billion in revenue in 2022, compared to over $136 billion in 2021, and over $127 billion in 2020. Ford posted a net loss of nearly $2 billion in 2022, compared to a net profit of almost $18 billion in 2021, and a net loss of over $1 billion in 2020. Compared to retail, Ford sold most of its cars via wholesale in 2022. In 2022, 52% of Ford’s vehicles (2 million) were sold via wholesale, vs. 48% sold via Retail (48%).The post Ford Profitability appeared first on FourWeekMBA.
March 15, 2023
Under Armour Revenue By Product
 Apparel revenue: $3.47 billion in 2019, $2.88 billion in 2020, and $3.84 billion in 2021. Apparel has been the largest revenue contributor in each year.Footwear revenue: $1.09 billion in 2019, $0.93 billion in 2020, and $1.26 billion in 2021. Footwear revenue showed a decline in 2020 but rebounded in 2021.Accessories revenue: $0.42 billion in 2019, $0.41 billion in 2020, and $0.46 billion in 2021. Accessories revenue remained relatively stable throughout the period.License revenues: $0.14 billion in 2019, $0.11 billion in 2020, and $0.11 billion in 2021. License revenues experienced a decline from 2019 to 2020 but remained stable in 2021.Corporate Other revenue: $0.16 billion in 2019, $0.14 billion in 2020, and $0.004 billion in 2021. Corporate Other revenue saw a significant decrease in 2021.Related Visual Stories
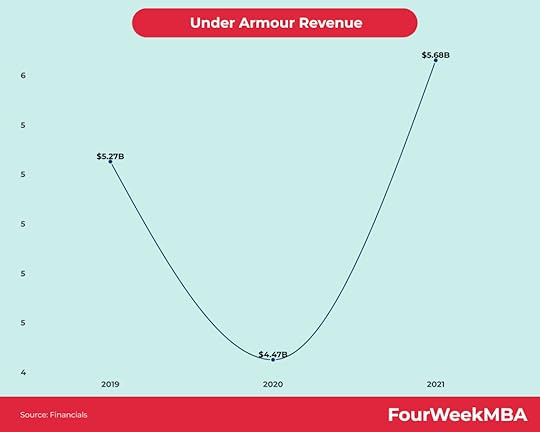 In 2021, the company’s net revenues increased to $5.68 billion, up from $4.47 billion in 2020, representing a 27% growth.The net revenues in 2021 were higher than the net revenues in 2019, which were $5.27 billion, representing an 8% growth compared to 2021.The decrease in net revenues from 2019 to 2020 was approximately 15%.
 In 2019, the company reported a net income of $0.09 billion.In 2020, the company had a net loss of $0.55 billion.In 2021, the company’s net income was $0.36 billion.
Under Armour Revenue By Channel
 In 2021, wholesale accounted for 57% of the company’s financial data.Licensing represented a smaller portion, contributing 2% to the financial data.Direct-to-consumer sales made up a significant share, comprising 41% of the financial data in 2021.
Under Armour Revenue By Product
 Apparel revenue: $3.47 billion in 2019, $2.88 billion in 2020, and $3.84 billion in 2021. Apparel has been the largest revenue contributor in each year.Footwear revenue: $1.09 billion in 2019, $0.93 billion in 2020, and $1.26 billion in 2021. Footwear revenue showed a decline in 2020 but rebounded in 2021.Accessories revenue: $0.42 billion in 2019, $0.41 billion in 2020, and $0.46 billion in 2021. Accessories revenue remained relatively stable throughout the period.License revenues: $0.14 billion in 2019, $0.11 billion in 2020, and $0.11 billion in 2021. License revenues experienced a decline from 2019 to 2020 but remained stable in 2021.Corporate Other revenue: $0.16 billion in 2019, $0.14 billion in 2020, and $0.004 billion in 2021. Corporate Other revenue saw a significant decrease in 2021.
Under Armour Revenue By Geography
 North America revenues: $3.66 billion in 2019, $2.94 billion in 2020, and $3.81 billion in 2021. EMEA revenues: $0.62 billion in 2019, $0.60 billion in 2020, and $0.84 billion in 2021. Asia-Pacific revenues: $0.64 billion in 2019, $0.63 billion in 2020, and $0.83 billion in 2021. Latin America revenues: $0.20 billion in 2019, $0.16 billion in 2020, and $0.20 billion in 2021. North America revenues: Decreased by 19.7% from 2019 to 2020, and increased by 29.4% from 2020 to 2021. EMEA revenues: Decreased by 3.2% from 2019 to 2020, and increased by 40.8% from 2020 to 2021. Asia-Pacific revenues: Decreased by 1.6% from 2019 to 2020, and increased by 32.3% from 2020 to 2021. Latin America revenues: Decreased by 20% from 2019 to 2020 and increased by 18.5% from 2020 to 2021.
Under Armour Profits By Geography
 North America operating income: Decreased by 35.3% from 2019 to 2020, and increased by 104.8% from 2020 to 2021. It contributed the most to the total operating income in each year.EMEA operating income: Increased by 12.8% from 2019 to 2020, and grew by 118.8% from 2020 to 2021. EMEA’s contribution to the total operating income increased over the years.Asia-Pacific operating income: Decreased by 100% from 2019 to 2020, and increased significantly from near-zero in 2020 to $132.91 million in 2021. The Asia-Pacific segment rebounded in 2021.Latin America operating income: Improved from -$3.16 million in 2019 to -$42.79 million in 2020, and turned positive with an increase of 152.3% to $22.39 million in 2021. Latin America’s contribution to the total operating income improved in 2021 after two years of negative operating income.
The post Under Armour Revenue By Product appeared first on FourWeekMBA.
Under Armour Profits By Geography
 North America operating income: $733.44 million in 2019, $474.58 million in 2020, and $972.09 million in 2021.EMEA operating income: $53.74 million in 2019, $60.59 million in 2020, and $132.60 million in 2021.Asia-Pacific operating income: $97.64 million in 2019, $0.002 million in 2020, and $132.91 million in 2021.Latin America operating income: -$3.16 million in 2019, -$42.79 million in 2020, and $22.39 million in 2021.North America operating income: Decreased by 35.3% from 2019 to 2020, and increased by 104.8% from 2020 to 2021. It contributed the most to the total operating income in each year.EMEA operating income: Increased by 12.8% from 2019 to 2020, and grew by 118.8% from 2020 to 2021. EMEA’s contribution to the total operating income increased over the years.Asia-Pacific operating income: Decreased by 100% from 2019 to 2020, and increased significantly from near-zero in 2020 to $132.91 million in 2021. The Asia-Pacific segment rebounded in 2021.Latin America operating income: Improved from -$3.16 million in 2019 to -$42.79 million in 2020, and turned positive with an increase of 152.3% to $22.39 million in 2021. Latin America’s contribution to the total operating income improved in 2021 after two years of negative operating income.Related Visual StoriesIn 2021, the company’s net revenues increased to $5.68 billion, up from $4.47 billion in 2020, representing a 27% growth.The net revenues in 2021 were higher than the net revenues in 2019, which were $5.27 billion, representing an 8% growth compared to 2021.The decrease in net revenues from 2019 to 2020 was approximately 15%.In 2019, the company reported a net income of $0.09 billion.In 2020, the company had a net loss of $0.55 billion.In 2021, the company’s net income was $0.36 billion.
Under Armour Revenue By Channel
In 2021, wholesale accounted for 57% of the company’s financial data.Licensing represented a smaller portion, contributing 2% to the financial data.Direct-to-consumer sales made up a significant share, comprising 41% of the financial data in 2021.Under Armour Revenue By Product
Apparel revenue: $3.47 billion in 2019, $2.88 billion in 2020, and $3.84 billion in 2021. Apparel has been the largest revenue contributor in each year.Footwear revenue: $1.09 billion in 2019, $0.93 billion in 2020, and $1.26 billion in 2021. Footwear revenue showed a decline in 2020 but rebounded in 2021.Accessories revenue: $0.42 billion in 2019, $0.41 billion in 2020, and $0.46 billion in 2021. Accessories revenue remained relatively stable throughout the period.License revenues: $0.14 billion in 2019, $0.11 billion in 2020, and $0.11 billion in 2021. License revenues experienced a decline from 2019 to 2020 but remained stable in 2021.Corporate Other revenue: $0.16 billion in 2019, $0.14 billion in 2020, and $0.004 billion in 2021. Corporate Other revenue saw a significant decrease in 2021.Under Armour Revenue By Geography
North America revenues: $3.66 billion in 2019, $2.94 billion in 2020, and $3.81 billion in 2021. EMEA revenues: $0.62 billion in 2019, $0.60 billion in 2020, and $0.84 billion in 2021. Asia-Pacific revenues: $0.64 billion in 2019, $0.63 billion in 2020, and $0.83 billion in 2021. Latin America revenues: $0.20 billion in 2019, $0.16 billion in 2020, and $0.20 billion in 2021. North America revenues: Decreased by 19.7% from 2019 to 2020, and increased by 29.4% from 2020 to 2021. EMEA revenues: Decreased by 3.2% from 2019 to 2020, and increased by 40.8% from 2020 to 2021. Asia-Pacific revenues: Decreased by 1.6% from 2019 to 2020, and increased by 32.3% from 2020 to 2021. Latin America revenues: Decreased by 20% from 2019 to 2020 and increased by 18.5% from 2020 to 2021.Under Armour Profits By Geography
North America operating income: Decreased by 35.3% from 2019 to 2020, and increased by 104.8% from 2020 to 2021. It contributed the most to the total operating income in each year.EMEA operating income: Increased by 12.8% from 2019 to 2020, and grew by 118.8% from 2020 to 2021. EMEA’s contribution to the total operating income increased over the years.Asia-Pacific operating income: Decreased by 100% from 2019 to 2020, and increased significantly from near-zero in 2020 to $132.91 million in 2021. The Asia-Pacific segment rebounded in 2021.Latin America operating income: Improved from -$3.16 million in 2019 to -$42.79 million in 2020, and turned positive with an increase of 152.3% to $22.39 million in 2021. Latin America’s contribution to the total operating income improved in 2021 after two years of negative operating income.The post Under Armour Profits By Geography appeared first on FourWeekMBA.
Under Armour Revenue By Geography
 North America revenues: $3.66 billion in 2019, $2.94 billion in 2020, and $3.81 billion in 2021.EMEA revenues: $0.62 billion in 2019, $0.60 billion in 2020, and $0.84 billion in 2021.Asia-Pacific revenues: $0.64 billion in 2019, $0.63 billion in 2020, and $0.83 billion in 2021.Latin America revenues: $0.20 billion in 2019, $0.16 billion in 2020, and $0.20 billion in 2021.North America revenues: Decreased by 19.7% from 2019 to 2020, and increased by 29.4% from 2020 to 2021.EMEA revenues: Decreased by 3.2% from 2019 to 2020, and increased by 40.8% from 2020 to 2021.Asia-Pacific revenues: Decreased by 1.6% from 2019 to 2020, and increased by 32.3% from 2020 to 2021.Latin America revenues: Decreased by 20% from 2019 to 2020, and increased by 18.5% from 2020 to 2021.
 Related Visual StoriesIn 2021, the company’s net revenues increased to $5.68 billion, up from $4.47 billion in 2020, representing a 27% growth.The net revenues in 2021 were higher than the net revenues in 2019, which were $5.27 billion, representing an 8% growth compared to 2021.The decrease in net revenues from 2019 to 2020 was approximately 15%.In 2019, the company reported a net income of $0.09 billion.In 2020, the company had a net loss of $0.55 billion.In 2021, the company’s net income was $0.36 billion.
Under Armour Revenue By Channel
In 2021, wholesale accounted for 57% of the company’s financial data.Licensing represented a smaller portion, contributing 2% to the financial data.Direct-to-consumer sales made up a significant share, comprising 41% of the financial data in 2021.Under Armour Revenue By Product
Apparel revenue: $3.47 billion in 2019, $2.88 billion in 2020, and $3.84 billion in 2021. Apparel has been the largest revenue contributor in each year.Footwear revenue: $1.09 billion in 2019, $0.93 billion in 2020, and $1.26 billion in 2021. Footwear revenue showed a decline in 2020 but rebounded in 2021.Accessories revenue: $0.42 billion in 2019, $0.41 billion in 2020, and $0.46 billion in 2021. Accessories revenue remained relatively stable throughout the period.License revenues: $0.14 billion in 2019, $0.11 billion in 2020, and $0.11 billion in 2021. License revenues experienced a decline from 2019 to 2020 but remained stable in 2021.Corporate Other revenue: $0.16 billion in 2019, $0.14 billion in 2020, and $0.004 billion in 2021. Corporate Other revenue saw a significant decrease in 2021.Under Armour Revenue By Geography
North America revenues: $3.66 billion in 2019, $2.94 billion in 2020, and $3.81 billion in 2021. EMEA revenues: $0.62 billion in 2019, $0.60 billion in 2020, and $0.84 billion in 2021. Asia-Pacific revenues: $0.64 billion in 2019, $0.63 billion in 2020, and $0.83 billion in 2021. Latin America revenues: $0.20 billion in 2019, $0.16 billion in 2020, and $0.20 billion in 2021. North America revenues: Decreased by 19.7% from 2019 to 2020, and increased by 29.4% from 2020 to 2021. EMEA revenues: Decreased by 3.2% from 2019 to 2020, and increased by 40.8% from 2020 to 2021. Asia-Pacific revenues: Decreased by 1.6% from 2019 to 2020, and increased by 32.3% from 2020 to 2021. Latin America revenues: Decreased by 20% from 2019 to 2020 and increased by 18.5% from 2020 to 2021.Under Armour Profits By Geography
North America operating income: Decreased by 35.3% from 2019 to 2020, and increased by 104.8% from 2020 to 2021. It contributed the most to the total operating income in each year.EMEA operating income: Increased by 12.8% from 2019 to 2020, and grew by 118.8% from 2020 to 2021. EMEA’s contribution to the total operating income increased over the years.Asia-Pacific operating income: Decreased by 100% from 2019 to 2020, and increased significantly from near-zero in 2020 to $132.91 million in 2021. The Asia-Pacific segment rebounded in 2021.Latin America operating income: Improved from -$3.16 million in 2019 to -$42.79 million in 2020, and turned positive with an increase of 152.3% to $22.39 million in 2021. Latin America’s contribution to the total operating income improved in 2021 after two years of negative operating income.The post Under Armour Revenue By Geography appeared first on FourWeekMBA.
Under Armour Revenue By Channel
 In 2021, wholesale accounted for 57% of the company’s financial data.Licensing represented a smaller portion, contributing 2% to the financial data.Direct-to-consumer sales made up a significant share, comprising 41% of the financial data in 2021.Related Visual StoriesIn 2021, the company’s net revenues increased to $5.68 billion, up from $4.47 billion in 2020, representing a 27% growth.The net revenues in 2021 were higher than the net revenues in 2019, which were $5.27 billion, representing an 8% growth compared to 2021.The decrease in net revenues from 2019 to 2020 was approximately 15%.In 2019, the company reported a net income of $0.09 billion.In 2020, the company had a net loss of $0.55 billion.In 2021, the company’s net income was $0.36 billion.
Under Armour Revenue By Channel
In 2021, wholesale accounted for 57% of the company’s financial data.Licensing represented a smaller portion, contributing 2% to the financial data.Direct-to-consumer sales made up a significant share, comprising 41% of the financial data in 2021.Under Armour Revenue By Product
Apparel revenue: $3.47 billion in 2019, $2.88 billion in 2020, and $3.84 billion in 2021. Apparel has been the largest revenue contributor in each year.Footwear revenue: $1.09 billion in 2019, $0.93 billion in 2020, and $1.26 billion in 2021. Footwear revenue showed a decline in 2020 but rebounded in 2021.Accessories revenue: $0.42 billion in 2019, $0.41 billion in 2020, and $0.46 billion in 2021. Accessories revenue remained relatively stable throughout the period.License revenues: $0.14 billion in 2019, $0.11 billion in 2020, and $0.11 billion in 2021. License revenues experienced a decline from 2019 to 2020 but remained stable in 2021.Corporate Other revenue: $0.16 billion in 2019, $0.14 billion in 2020, and $0.004 billion in 2021. Corporate Other revenue saw a significant decrease in 2021.Under Armour Revenue By Geography
North America revenues: $3.66 billion in 2019, $2.94 billion in 2020, and $3.81 billion in 2021. EMEA revenues: $0.62 billion in 2019, $0.60 billion in 2020, and $0.84 billion in 2021. Asia-Pacific revenues: $0.64 billion in 2019, $0.63 billion in 2020, and $0.83 billion in 2021. Latin America revenues: $0.20 billion in 2019, $0.16 billion in 2020, and $0.20 billion in 2021. North America revenues: Decreased by 19.7% from 2019 to 2020, and increased by 29.4% from 2020 to 2021. EMEA revenues: Decreased by 3.2% from 2019 to 2020, and increased by 40.8% from 2020 to 2021. Asia-Pacific revenues: Decreased by 1.6% from 2019 to 2020, and increased by 32.3% from 2020 to 2021. Latin America revenues: Decreased by 20% from 2019 to 2020 and increased by 18.5% from 2020 to 2021.Under Armour Profits By Geography
North America operating income: Decreased by 35.3% from 2019 to 2020, and increased by 104.8% from 2020 to 2021. It contributed the most to the total operating income in each year.EMEA operating income: Increased by 12.8% from 2019 to 2020, and grew by 118.8% from 2020 to 2021. EMEA’s contribution to the total operating income increased over the years.Asia-Pacific operating income: Decreased by 100% from 2019 to 2020, and increased significantly from near-zero in 2020 to $132.91 million in 2021. The Asia-Pacific segment rebounded in 2021.Latin America operating income: Improved from -$3.16 million in 2019 to -$42.79 million in 2020, and turned positive with an increase of 152.3% to $22.39 million in 2021. Latin America’s contribution to the total operating income improved in 2021 after two years of negative operating income.The post Under Armour Revenue By Channel appeared first on FourWeekMBA.
Under Armour Profitability
 In 2019, the company reported a net income of $0.09 billion.In 2020, the company had a net loss of $0.55 billion.In 2021, the company’s net income was $0.36 billion.Related Visual StoriesIn 2021, the company’s net revenues increased to $5.68 billion, up from $4.47 billion in 2020, representing a 27% growth.The net revenues in 2021 were higher than the net revenues in 2019, which were $5.27 billion, representing an 8% growth compared to 2021.The decrease in net revenues from 2019 to 2020 was approximately 15%.In 2019, the company reported a net income of $0.09 billion.In 2020, the company had a net loss of $0.55 billion.In 2021, the company’s net income was $0.36 billion.
Under Armour Revenue By Channel
In 2021, wholesale accounted for 57% of the company’s financial data.Licensing represented a smaller portion, contributing 2% to the financial data.Direct-to-consumer sales made up a significant share, comprising 41% of the financial data in 2021.Under Armour Revenue By Product
Apparel revenue: $3.47 billion in 2019, $2.88 billion in 2020, and $3.84 billion in 2021. Apparel has been the largest revenue contributor in each year.Footwear revenue: $1.09 billion in 2019, $0.93 billion in 2020, and $1.26 billion in 2021. Footwear revenue showed a decline in 2020 but rebounded in 2021.Accessories revenue: $0.42 billion in 2019, $0.41 billion in 2020, and $0.46 billion in 2021. Accessories revenue remained relatively stable throughout the period.License revenues: $0.14 billion in 2019, $0.11 billion in 2020, and $0.11 billion in 2021. License revenues experienced a decline from 2019 to 2020 but remained stable in 2021.Corporate Other revenue: $0.16 billion in 2019, $0.14 billion in 2020, and $0.004 billion in 2021. Corporate Other revenue saw a significant decrease in 2021.Under Armour Revenue By Geography
North America revenues: $3.66 billion in 2019, $2.94 billion in 2020, and $3.81 billion in 2021. EMEA revenues: $0.62 billion in 2019, $0.60 billion in 2020, and $0.84 billion in 2021. Asia-Pacific revenues: $0.64 billion in 2019, $0.63 billion in 2020, and $0.83 billion in 2021. Latin America revenues: $0.20 billion in 2019, $0.16 billion in 2020, and $0.20 billion in 2021. North America revenues: Decreased by 19.7% from 2019 to 2020, and increased by 29.4% from 2020 to 2021. EMEA revenues: Decreased by 3.2% from 2019 to 2020, and increased by 40.8% from 2020 to 2021. Asia-Pacific revenues: Decreased by 1.6% from 2019 to 2020, and increased by 32.3% from 2020 to 2021. Latin America revenues: Decreased by 20% from 2019 to 2020 and increased by 18.5% from 2020 to 2021.Under Armour Profits By Geography
North America operating income: Decreased by 35.3% from 2019 to 2020, and increased by 104.8% from 2020 to 2021. It contributed the most to the total operating income in each year.EMEA operating income: Increased by 12.8% from 2019 to 2020, and grew by 118.8% from 2020 to 2021. EMEA’s contribution to the total operating income increased over the years.Asia-Pacific operating income: Decreased by 100% from 2019 to 2020, and increased significantly from near-zero in 2020 to $132.91 million in 2021. The Asia-Pacific segment rebounded in 2021.Latin America operating income: Improved from -$3.16 million in 2019 to -$42.79 million in 2020, and turned positive with an increase of 152.3% to $22.39 million in 2021. Latin America’s contribution to the total operating income improved in 2021 after two years of negative operating income.The post Under Armour Profitability appeared first on FourWeekMBA.
Under Armour Financials
 From 2019 to 2021, the revenue increased by 8%, growing from $5.27 billion to $5.68 billion.During the same period, the net income showed a significant improvement, rising from $0.09 billion in 2019 to $0.36 billion in 2021.Comparing 2020 to 2021, there was a notable turnaround in net income, from a loss of $0.55 billion in 2020 to a gain of $0.36 billion in 2021.Between 2019 and 2020, the company experienced a decrease in revenue of 15%, dropping from $5.27 billion to $4.47 billion, while net income changed from a gain of $0.09 billion in 2019 to a loss of $0.55 billion in 2020.Related Visual StoriesIn 2021, the company’s net revenues increased to $5.68 billion, up from $4.47 billion in 2020, representing a 27% growth.The net revenues in 2021 were higher than the net revenues in 2019, which were $5.27 billion, representing an 8% growth compared to 2021.The decrease in net revenues from 2019 to 2020 was approximately 15%.In 2019, the company reported a net income of $0.09 billion.In 2020, the company had a net loss of $0.55 billion.In 2021, the company’s net income was $0.36 billion.
Under Armour Revenue By Channel
In 2021, wholesale accounted for 57% of the company’s financial data.Licensing represented a smaller portion, contributing 2% to the financial data.Direct-to-consumer sales made up a significant share, comprising 41% of the financial data in 2021.Under Armour Revenue By Product
Apparel revenue: $3.47 billion in 2019, $2.88 billion in 2020, and $3.84 billion in 2021. Apparel has been the largest revenue contributor in each year.Footwear revenue: $1.09 billion in 2019, $0.93 billion in 2020, and $1.26 billion in 2021. Footwear revenue showed a decline in 2020 but rebounded in 2021.Accessories revenue: $0.42 billion in 2019, $0.41 billion in 2020, and $0.46 billion in 2021. Accessories revenue remained relatively stable throughout the period.License revenues: $0.14 billion in 2019, $0.11 billion in 2020, and $0.11 billion in 2021. License revenues experienced a decline from 2019 to 2020 but remained stable in 2021.Corporate Other revenue: $0.16 billion in 2019, $0.14 billion in 2020, and $0.004 billion in 2021. Corporate Other revenue saw a significant decrease in 2021.Under Armour Revenue By Geography
North America revenues: $3.66 billion in 2019, $2.94 billion in 2020, and $3.81 billion in 2021. EMEA revenues: $0.62 billion in 2019, $0.60 billion in 2020, and $0.84 billion in 2021. Asia-Pacific revenues: $0.64 billion in 2019, $0.63 billion in 2020, and $0.83 billion in 2021. Latin America revenues: $0.20 billion in 2019, $0.16 billion in 2020, and $0.20 billion in 2021. North America revenues: Decreased by 19.7% from 2019 to 2020, and increased by 29.4% from 2020 to 2021. EMEA revenues: Decreased by 3.2% from 2019 to 2020, and increased by 40.8% from 2020 to 2021. Asia-Pacific revenues: Decreased by 1.6% from 2019 to 2020, and increased by 32.3% from 2020 to 2021. Latin America revenues: Decreased by 20% from 2019 to 2020 and increased by 18.5% from 2020 to 2021.Under Armour Profits By Geography
North America operating income: Decreased by 35.3% from 2019 to 2020, and increased by 104.8% from 2020 to 2021. It contributed the most to the total operating income in each year.EMEA operating income: Increased by 12.8% from 2019 to 2020, and grew by 118.8% from 2020 to 2021. EMEA’s contribution to the total operating income increased over the years.Asia-Pacific operating income: Decreased by 100% from 2019 to 2020, and increased significantly from near-zero in 2020 to $132.91 million in 2021. The Asia-Pacific segment rebounded in 2021.Latin America operating income: Improved from -$3.16 million in 2019 to -$42.79 million in 2020, and turned positive with an increase of 152.3% to $22.39 million in 2021. Latin America’s contribution to the total operating income improved in 2021 after two years of negative operating income.The post Under Armour Financials appeared first on FourWeekMBA.
Under Armour Revenue
 In 2021, the company’s net revenues increased to $5.68 billion, up from $4.47 billion in 2020, representing a 27% growth.The net revenues in 2021 were higher than the net revenues in 2019, which were $5.27 billion, representing an 8% growth compared to 2021.The decrease in net revenues from 2019 to 2020 was approximately 15%.Related Visual StoriesIn 2021, the company’s net revenues increased to $5.68 billion, up from $4.47 billion in 2020, representing a 27% growth.The net revenues in 2021 were higher than the net revenues in 2019, which were $5.27 billion, representing an 8% growth compared to 2021.The decrease in net revenues from 2019 to 2020 was approximately 15%.In 2019, the company reported a net income of $0.09 billion.In 2020, the company had a net loss of $0.55 billion.In 2021, the company’s net income was $0.36 billion.
Under Armour Revenue By Channel
In 2021, wholesale accounted for 57% of the company’s financial data.Licensing represented a smaller portion, contributing 2% to the financial data.Direct-to-consumer sales made up a significant share, comprising 41% of the financial data in 2021.Under Armour Revenue By Product
Apparel revenue: $3.47 billion in 2019, $2.88 billion in 2020, and $3.84 billion in 2021. Apparel has been the largest revenue contributor in each year.Footwear revenue: $1.09 billion in 2019, $0.93 billion in 2020, and $1.26 billion in 2021. Footwear revenue showed a decline in 2020 but rebounded in 2021.Accessories revenue: $0.42 billion in 2019, $0.41 billion in 2020, and $0.46 billion in 2021. Accessories revenue remained relatively stable throughout the period.License revenues: $0.14 billion in 2019, $0.11 billion in 2020, and $0.11 billion in 2021. License revenues experienced a decline from 2019 to 2020 but remained stable in 2021.Corporate Other revenue: $0.16 billion in 2019, $0.14 billion in 2020, and $0.004 billion in 2021. Corporate Other revenue saw a significant decrease in 2021.Under Armour Revenue By Geography
North America revenues: $3.66 billion in 2019, $2.94 billion in 2020, and $3.81 billion in 2021. EMEA revenues: $0.62 billion in 2019, $0.60 billion in 2020, and $0.84 billion in 2021. Asia-Pacific revenues: $0.64 billion in 2019, $0.63 billion in 2020, and $0.83 billion in 2021. Latin America revenues: $0.20 billion in 2019, $0.16 billion in 2020, and $0.20 billion in 2021. North America revenues: Decreased by 19.7% from 2019 to 2020, and increased by 29.4% from 2020 to 2021. EMEA revenues: Decreased by 3.2% from 2019 to 2020, and increased by 40.8% from 2020 to 2021. Asia-Pacific revenues: Decreased by 1.6% from 2019 to 2020, and increased by 32.3% from 2020 to 2021. Latin America revenues: Decreased by 20% from 2019 to 2020 and increased by 18.5% from 2020 to 2021.Under Armour Profits By Geography
North America operating income: Decreased by 35.3% from 2019 to 2020, and increased by 104.8% from 2020 to 2021. It contributed the most to the total operating income in each year.EMEA operating income: Increased by 12.8% from 2019 to 2020, and grew by 118.8% from 2020 to 2021. EMEA’s contribution to the total operating income increased over the years.Asia-Pacific operating income: Decreased by 100% from 2019 to 2020, and increased significantly from near-zero in 2020 to $132.91 million in 2021. The Asia-Pacific segment rebounded in 2021.Latin America operating income: Improved from -$3.16 million in 2019 to -$42.79 million in 2020, and turned positive with an increase of 152.3% to $22.39 million in 2021. Latin America’s contribution to the total operating income improved in 2021 after two years of negative operating income.The post Under Armour Revenue appeared first on FourWeekMBA.


