
Gennaro Cuofano's Blog, page 81
March 26, 2023
Pluto TV Revenue
 Pluto TV’s revenue in 2020 was $0.56 billion.In 2021, the revenue almost doubled, reaching $1.06 billion, which indicates a significant improvement in the platform’s financial performance.The growth trend continued, albeit at a slower pace, in 2022, with revenue rising to $1.11 billion, representing an increase of about 4.7% compared to the previous year.
 The Pluto TV subscriber count in 2020 was 43.1 million.There was a notable increase in subscribers in 2021, with the count rising to 64.4 million, representing a growth of approximately 49.4% compared to the previous year.The growth trend continued in 2022, with the subscriber count reaching 78.5 million, a further increase of about 21.9% compared to the previous year.Related To Paramount
 The revenue experienced a steady increase between 2018 and 2019, growing from $27.25 billion to $27.81 billion. In 2020, revenue was a noticeable decline to $25.28 billion, indicating a slowdown in growth. The trend reversed in 2021, with revenue bouncing back to $28.58 billion, surpassing 2019. The revenue continued its upward trajectory in 2022, reaching $30.15 billion, marking the highest revenue figure in five years. Despite the dip in 2020, Paramount’s revenue demonstrates a general growth trend over the five years.
 Profits in 2018 were $3.46 billion but experienced a slight decline to $3.3 billion in 2019.A more significant drop in profits occurred in 2020, falling to $2 billion.In 2021, profits rebounded strongly to $4.38 billion, marking the highest profit figure in five years.However, profits took a sharp downturn in 2022, decreasing to just $0.725 billion, representing a substantial decline compared to the previous years.
 TV Media revenue decreased from $22.73 billion in 2021 to $21.73 billion in 2022, marking a decline of approximately 4.4%.Direct-to-Consumer revenue experienced substantial growth, from $3.33 billion in 2021 to $4.9 billion in 2022, a rise of about 47.1%.Filmed Entertainment revenue also increased, growing from $2.69 billion in 2021 to $3.7 billion in 2022, representing an increase of around 37.5%.Eliminations representing intersegment transactions showed a slight increase in negative value from -$0.162 billion in 2021 to -$0.188 billion in 2022, indicating a higher level of intersegment revenue offsets.While the TV Media segment experienced a decline, Direct-to-Consumer and Filmed Entertainment revenue streams showed significant growth, contributing to the overall increase in Paramount’s total revenue.
 The number of Paramount+ subscribers in 2020 was 11.7 million.There was a significant increase in subscribers in 2021, with the count rising to 32.8 million, representing a growth of approximately 180%.The growth trend continued in 2022, with the subscriber count reaching 55.9 million, a further increase of about 70% compared to the previous year.
 Paramount+ revenue in 2020 was $0.63 billion.In 2021, the revenue more than doubled, reaching $1.35 billion, which indicates a significant increase in the platform’s performance.The growth trend persisted in 2022, with revenue climbing to $2.77 billion, representing a growth of over 100% compared to the previous year.
 Pluto TV’s revenue in 2020 was $0.56 billion.In 2021, the revenue almost doubled, reaching $1.06 billion, which indicates a significant improvement in the platform’s financial performance.The growth trend continued, albeit at a slower pace, in 2022, with revenue rising to $1.11 billion, representing an increase of about 4.7% compared to the previous year.
Paramount Content Monetization
 In 2020, Paramount’s revenue of $25.28 billion was approximately 2.12 times its content costs of $11.93 billion.In 2021, the revenue increased to $28.58 billion, while content costs rose to $14.7 billion. The revenue was about 1.94 times the content costs during this year.Comparing both years, the revenue-to-content-costs multiplier decreased from 2020 to 2021, indicating that the company’s content costs have increased faster than its revenue. This could result from investments in original content, increased licensing fees, or other content-related expenses.
 Paramount is a Media powerhouse comprising many media brands, which generated over $30 billion in revenue in 2022, comprising brands like CBS, Paramount, Nickelodeon, MTV, Paramount+, Pluto TV, and many others.
 The post Pluto TV Revenue appeared first on FourWeekMBA.


Pluto TV Users
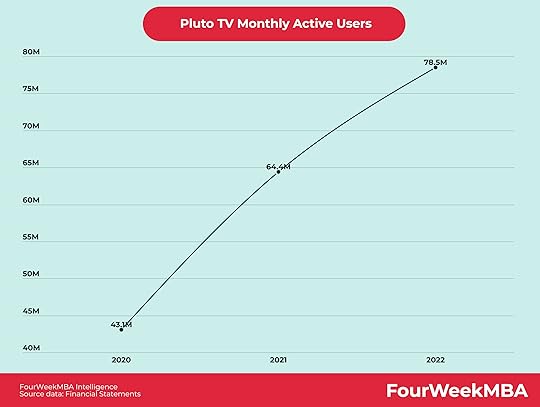 The Pluto TV subscriber count in 2020 was 43.1 million.There was a notable increase in subscribers in 2021, with the count rising to 64.4 million, representing a growth of approximately 49.4% compared to the previous year.The growth trend continued in 2022, with the subscriber count reaching 78.5 million, a further increase of about 21.9% compared to the previous year.Related To ParamountThe revenue experienced a steady increase between 2018 and 2019, growing from $27.25 billion to $27.81 billion. In 2020, revenue was a noticeable decline to $25.28 billion, indicating a slowdown in growth. The trend reversed in 2021, with revenue bouncing back to $28.58 billion, surpassing 2019. The revenue continued its upward trajectory in 2022, reaching $30.15 billion, marking the highest revenue figure in five years. Despite the dip in 2020, Paramount’s revenue demonstrates a general growth trend over the five years.Profits in 2018 were $3.46 billion but experienced a slight decline to $3.3 billion in 2019.A more significant drop in profits occurred in 2020, falling to $2 billion.In 2021, profits rebounded strongly to $4.38 billion, marking the highest profit figure in five years.However, profits took a sharp downturn in 2022, decreasing to just $0.725 billion, representing a substantial decline compared to the previous years.TV Media revenue decreased from $22.73 billion in 2021 to $21.73 billion in 2022, marking a decline of approximately 4.4%.Direct-to-Consumer revenue experienced substantial growth, from $3.33 billion in 2021 to $4.9 billion in 2022, a rise of about 47.1%.Filmed Entertainment revenue also increased, growing from $2.69 billion in 2021 to $3.7 billion in 2022, representing an increase of around 37.5%.Eliminations representing intersegment transactions showed a slight increase in negative value from -$0.162 billion in 2021 to -$0.188 billion in 2022, indicating a higher level of intersegment revenue offsets.While the TV Media segment experienced a decline, Direct-to-Consumer and Filmed Entertainment revenue streams showed significant growth, contributing to the overall increase in Paramount’s total revenue.The number of Paramount+ subscribers in 2020 was 11.7 million.There was a significant increase in subscribers in 2021, with the count rising to 32.8 million, representing a growth of approximately 180%.The growth trend continued in 2022, with the subscriber count reaching 55.9 million, a further increase of about 70% compared to the previous year.Paramount+ revenue in 2020 was $0.63 billion.In 2021, the revenue more than doubled, reaching $1.35 billion, which indicates a significant increase in the platform’s performance.The growth trend persisted in 2022, with revenue climbing to $2.77 billion, representing a growth of over 100% compared to the previous year.Pluto TV’s revenue in 2020 was $0.56 billion.In 2021, the revenue almost doubled, reaching $1.06 billion, which indicates a significant improvement in the platform’s financial performance.The growth trend continued, albeit at a slower pace, in 2022, with revenue rising to $1.11 billion, representing an increase of about 4.7% compared to the previous year.
Paramount Content Monetization
In 2020, Paramount’s revenue of $25.28 billion was approximately 2.12 times its content costs of $11.93 billion.In 2021, the revenue increased to $28.58 billion, while content costs rose to $14.7 billion. The revenue was about 1.94 times the content costs during this year.Comparing both years, the revenue-to-content-costs multiplier decreased from 2020 to 2021, indicating that the company’s content costs have increased faster than its revenue. This could result from investments in original content, increased licensing fees, or other content-related expenses.Paramount is a Media powerhouse comprising many media brands, which generated over $30 billion in revenue in 2022, comprising brands like CBS, Paramount, Nickelodeon, MTV, Paramount+, Pluto TV, and many others. The post Pluto TV Users appeared first on FourWeekMBA.
Paramount+ Revenue Per Subscriber
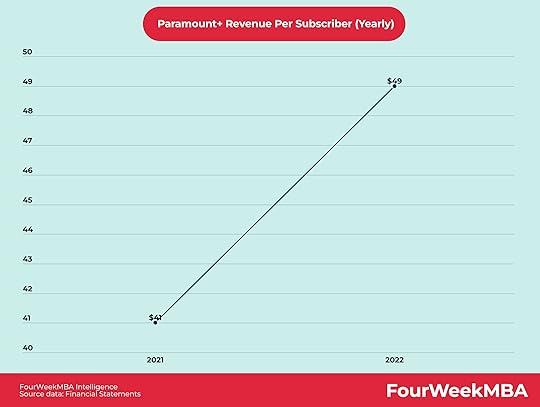 The yearly revenue per subscriber for Paramount+ increased between 2021 and 2022.In 2021, the revenue per subscriber was $41, indicating the average annual income generated per user on the platform.The figure rose to $49 in 2022, representing a growth of approximately 19.5% compared to the previous year.The number of Paramount+ subscribers in 2020 was 11.7 million.There was a significant increase in subscribers in 2021, with the count rising to 32.8 million, representing a growth of approximately 180%.The growth trend continued in 2022, with the subscriber count reaching 55.9 million, a further increase of about 70% compared to the previous year.Paramount+ revenue in 2020 was $0.63 billion.In 2021, the revenue more than doubled, reaching $1.35 billion, which indicates a significant increase in the platform’s performance.The growth trend persisted in 2022, with revenue climbing to $2.77 billion, representing a growth of over 100% compared to the previous year.Related To ParamountThe revenue experienced a steady increase between 2018 and 2019, growing from $27.25 billion to $27.81 billion. In 2020, revenue was a noticeable decline to $25.28 billion, indicating a slowdown in growth. The trend reversed in 2021, with revenue bouncing back to $28.58 billion, surpassing 2019. The revenue continued its upward trajectory in 2022, reaching $30.15 billion, marking the highest revenue figure in five years. Despite the dip in 2020, Paramount’s revenue demonstrates a general growth trend over the five years.Profits in 2018 were $3.46 billion but experienced a slight decline to $3.3 billion in 2019.A more significant drop in profits occurred in 2020, falling to $2 billion.In 2021, profits rebounded strongly to $4.38 billion, marking the highest profit figure in five years.However, profits took a sharp downturn in 2022, decreasing to just $0.725 billion, representing a substantial decline compared to the previous years.TV Media revenue decreased from $22.73 billion in 2021 to $21.73 billion in 2022, marking a decline of approximately 4.4%.Direct-to-Consumer revenue experienced substantial growth, from $3.33 billion in 2021 to $4.9 billion in 2022, a rise of about 47.1%.Filmed Entertainment revenue also increased, growing from $2.69 billion in 2021 to $3.7 billion in 2022, representing an increase of around 37.5%.Eliminations representing intersegment transactions showed a slight increase in negative value from -$0.162 billion in 2021 to -$0.188 billion in 2022, indicating a higher level of intersegment revenue offsets.While the TV Media segment experienced a decline, Direct-to-Consumer and Filmed Entertainment revenue streams showed significant growth, contributing to the overall increase in Paramount’s total revenue.The number of Paramount+ subscribers in 2020 was 11.7 million.There was a significant increase in subscribers in 2021, with the count rising to 32.8 million, representing a growth of approximately 180%.The growth trend continued in 2022, with the subscriber count reaching 55.9 million, a further increase of about 70% compared to the previous year.Paramount+ revenue in 2020 was $0.63 billion.In 2021, the revenue more than doubled, reaching $1.35 billion, which indicates a significant increase in the platform’s performance.The growth trend persisted in 2022, with revenue climbing to $2.77 billion, representing a growth of over 100% compared to the previous year.Pluto TV’s revenue in 2020 was $0.56 billion.In 2021, the revenue almost doubled, reaching $1.06 billion, which indicates a significant improvement in the platform’s financial performance.The growth trend continued, albeit at a slower pace, in 2022, with revenue rising to $1.11 billion, representing an increase of about 4.7% compared to the previous year.
Paramount Content Monetization
In 2020, Paramount’s revenue of $25.28 billion was approximately 2.12 times its content costs of $11.93 billion.In 2021, the revenue increased to $28.58 billion, while content costs rose to $14.7 billion. The revenue was about 1.94 times the content costs during this year.Comparing both years, the revenue-to-content-costs multiplier decreased from 2020 to 2021, indicating that the company’s content costs have increased faster than its revenue. This could result from investments in original content, increased licensing fees, or other content-related expenses.Paramount is a Media powerhouse comprising many media brands, which generated over $30 billion in revenue in 2022, comprising brands like CBS, Paramount, Nickelodeon, MTV, Paramount+, Pluto TV, and many others. The post Paramount+ Revenue Per Subscriber appeared first on FourWeekMBA.
March 21, 2023
Hinge Revenue

Hinge generated over $283 million in revenue in 2022, compared to over $196 million in 2021 and over $90 million in 2020.
The post Hinge Revenue appeared first on FourWeekMBA.
Tinder Revenue

Tinger generated $1.79 billion in revenue in 2022, compared to $1.65 billion in 2021 and $1.35 billion in 2020.
The post Tinder Revenue appeared first on FourWeekMBA.
UPS vs. FedEx
 In 2018, FedEx’s revenue was $65 billion, while UPS’s revenue was higher at $71.86 billion.In 2019, both companies experienced revenue growth, with FedEx reaching $69.69 billion (an increase of 7.2% compared to 2018) and UPS rising to $74.09 billion (an increase of 3.1% compared to 2018).In 2020, FedEx’s revenue slightly decreased to $69.22 billion (a decline of 0.7% compared to 2019), while UPS’s revenue grew significantly to $84.63 billion (an increase of 14.2% compared to 2019).In 2021, both companies saw substantial revenue growth, with FedEx reaching $83.96 billion (an increase of 21.3% compared to 2020) and UPS growing to $97.29 billion (an increase of 15% compared to 2020).In 2022, both companies continued their revenue growth trend, with FedEx at $93.51 billion (an increase of 11.4% compared to 2021) and UPS at $100.33 billion (an increase of 3.1% compared to 2021).Related Visual Stories
 In 2019, FedEx experienced a revenue growth of approximately 7.2% compared to 2018, increasing from $65 billion to $69.69 billion.Despite a slight decrease in 2020 to $69.22 billion, FedEx saw a substantial revenue growth of 21.3% in 2021, reaching $83.96 billion.The positive trend continued in 2022, with revenue increasing by 11.4% to $93.51 billion, showing consistent growth over the years except for 2020.
 FedEx experienced a significant drop in net income from $4.57 billion in 2018 to $0.540 billion in 2019, representing a decrease of approximately 88.2%.In 2020, net income rebounded to $1.28 billion, showing an increase of 137% compared to the previous year.The upward trend continued in 2021, with net income surging to $5.23 billion, which is a 308% increase compared to 2020.However, in 2022, net income decreased to $3.82 billion, a decline of around 27% compared to the previous year.
 Between 2019 and 2020, FedEx experienced an increase in the number of employees, with a growth of 2.5% from 239,000 to 245,000.In 2021, the company saw a more significant increase in employees, growing by 18% to reach 289,000.The upward trend in employee numbers continued in 2022, with an increase of 19.4%, bringing the total number of employees to 345,000.
 FedEx’s revenue per package experienced a slight increase of 0.8% from 2018 to 2019, growing from $18.40 to $18.54.In 2020, revenue per package decreased by 1.3% to $18.30 compared to the previous year.The downward trend continued in 2021, with a decrease of 2.8% to $17.79 compared to 2020.However, in 2022, revenue per package increased substantially by 13.3% to $20.15, reversing the previous downward trend.
 UPS experienced a revenue growth of approximately 3.1% from 2018 to 2019, increasing from $71.86 billion to $74.09 billion.In 2020, the revenue showed a significant increase of 14.2% to $84.63 billion compared to the previous year.The upward trend continued in 2021, with revenue growing by 15% to reach $97.29 billion.In 2022, revenue increased by 3.1% to $100.33 billion, continuing the positive growth trend over the years.
 In 2019, UPS’s net income decreased by 7.3% compared to 2018, falling from $4.79 billion to $4.44 billion.The net income experienced a more significant drop in 2020, decreasing by 69.8% to $1.34 billion compared to the previous year.A substantial rebound occurred in 2021, with net income surging to $12.89 billion, representing an increase of 861% compared to 2020.In 2022, the net income decreased slightly to $11.55 billion, representing a decline of around 10.4% compared to the previous year.
 For the U.S. Domestic Package segment, the revenue in 2022 was $64.2 billion, with an operating profit of $6.99 billion.In the International Package segment, the 2022 revenue was $19.7 billion, while the operating profit reached $4.3 billion.In the Supply Chain Solutions segment, the revenue for 2022 was $16.43 billion, with an operating profit of $1.77 billion.
 In 2019, UPS’s average revenue per piece (ARP) slightly decreased by 0.3% compared to 2018, moving from $9.86 to $9.83.The ARP experienced a small increase of 0.9% in 2020, rising to $9.92 compared to the previous year.In 2021, the ARP saw a more significant growth of 11.5%, reaching $11.06 compared to 2020.In 2022, the growth trend continued, with the ARP increasing by 9.5% to $12.11 compared to the previous year, indicating an upward trend in the average revenue per piece.
The post UPS vs. FedEx appeared first on FourWeekMBA.
UPS Average Revenue Per Package
 In 2019, UPS’s average revenue per piece (ARP) slightly decreased by 0.3% compared to 2018, moving from $9.86 to $9.83.The ARP experienced a small increase of 0.9% in 2020, rising to $9.92 compared to the previous year.In 2021, the ARP saw a more significant growth of 11.5%, reaching $11.06 compared to 2020.In 2022, the growth trend continued, with the ARP increasing by 9.5% to $12.11 compared to the previous year, indicating an upward trend in the average revenue per piece.Related Visual StoriesIn 2019, FedEx experienced a revenue growth of approximately 7.2% compared to 2018, increasing from $65 billion to $69.69 billion.Despite a slight decrease in 2020 to $69.22 billion, FedEx saw a substantial revenue growth of 21.3% in 2021, reaching $83.96 billion.The positive trend continued in 2022, with revenue increasing by 11.4% to $93.51 billion, showing consistent growth over the years except for 2020.FedEx experienced a significant drop in net income from $4.57 billion in 2018 to $0.540 billion in 2019, representing a decrease of approximately 88.2%.In 2020, net income rebounded to $1.28 billion, showing an increase of 137% compared to the previous year.The upward trend continued in 2021, with net income surging to $5.23 billion, which is a 308% increase compared to 2020.However, in 2022, net income decreased to $3.82 billion, a decline of around 27% compared to the previous year.Between 2019 and 2020, FedEx experienced an increase in the number of employees, with a growth of 2.5% from 239,000 to 245,000.In 2021, the company saw a more significant increase in employees, growing by 18% to reach 289,000.The upward trend in employee numbers continued in 2022, with an increase of 19.4%, bringing the total number of employees to 345,000.FedEx’s revenue per package experienced a slight increase of 0.8% from 2018 to 2019, growing from $18.40 to $18.54.In 2020, revenue per package decreased by 1.3% to $18.30 compared to the previous year.The downward trend continued in 2021, with a decrease of 2.8% to $17.79 compared to 2020.However, in 2022, revenue per package increased substantially by 13.3% to $20.15, reversing the previous downward trend.UPS experienced a revenue growth of approximately 3.1% from 2018 to 2019, increasing from $71.86 billion to $74.09 billion.In 2020, the revenue showed a significant increase of 14.2% to $84.63 billion compared to the previous year.The upward trend continued in 2021, with revenue growing by 15% to reach $97.29 billion.In 2022, revenue increased by 3.1% to $100.33 billion, continuing the positive growth trend over the years.In 2019, UPS’s net income decreased by 7.3% compared to 2018, falling from $4.79 billion to $4.44 billion.The net income experienced a more significant drop in 2020, decreasing by 69.8% to $1.34 billion compared to the previous year.A substantial rebound occurred in 2021, with net income surging to $12.89 billion, representing an increase of 861% compared to 2020.In 2022, the net income decreased slightly to $11.55 billion, representing a decline of around 10.4% compared to the previous year.For the U.S. Domestic Package segment, the revenue in 2022 was $64.2 billion, with an operating profit of $6.99 billion.In the International Package segment, the 2022 revenue was $19.7 billion, while the operating profit reached $4.3 billion.In the Supply Chain Solutions segment, the revenue for 2022 was $16.43 billion, with an operating profit of $1.77 billion.In 2019, UPS’s average revenue per piece (ARP) slightly decreased by 0.3% compared to 2018, moving from $9.86 to $9.83.The ARP experienced a small increase of 0.9% in 2020, rising to $9.92 compared to the previous year.In 2021, the ARP saw a more significant growth of 11.5%, reaching $11.06 compared to 2020.In 2022, the growth trend continued, with the ARP increasing by 9.5% to $12.11 compared to the previous year, indicating an upward trend in the average revenue per piece.
The post UPS Average Revenue Per Package appeared first on FourWeekMBA.
UPS Average Daily Package Volume
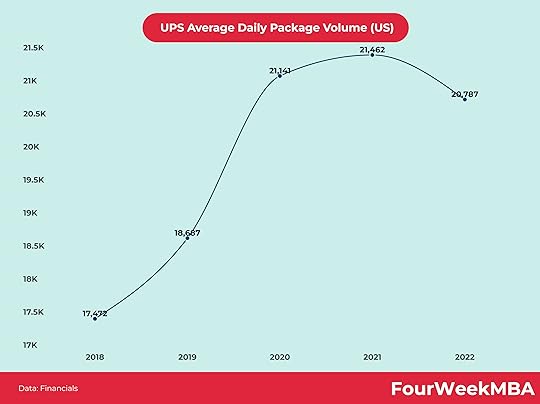 In 2019, UPS’s average daily package (ADP) volume increased by 6.9% compared to 2018, growing from 17,472 to 18,687.The ADP volume experienced a more significant increase of 13.1% in 2020, rising to 21,141 compared to the previous year.In 2021, the growth trend slowed down, with the ADP volume increasing by only 1.5% to 21,462 compared to 2020.In 2022, the ADP volume decreased by 3.1% to 20,787 compared to the previous year, indicating a decline in the average daily package volume.Related Visual StoriesIn 2019, FedEx experienced a revenue growth of approximately 7.2% compared to 2018, increasing from $65 billion to $69.69 billion.Despite a slight decrease in 2020 to $69.22 billion, FedEx saw a substantial revenue growth of 21.3% in 2021, reaching $83.96 billion.The positive trend continued in 2022, with revenue increasing by 11.4% to $93.51 billion, showing consistent growth over the years except for 2020.FedEx experienced a significant drop in net income from $4.57 billion in 2018 to $0.540 billion in 2019, representing a decrease of approximately 88.2%.In 2020, net income rebounded to $1.28 billion, showing an increase of 137% compared to the previous year.The upward trend continued in 2021, with net income surging to $5.23 billion, which is a 308% increase compared to 2020.However, in 2022, net income decreased to $3.82 billion, a decline of around 27% compared to the previous year.Between 2019 and 2020, FedEx experienced an increase in the number of employees, with a growth of 2.5% from 239,000 to 245,000.In 2021, the company saw a more significant increase in employees, growing by 18% to reach 289,000.The upward trend in employee numbers continued in 2022, with an increase of 19.4%, bringing the total number of employees to 345,000.FedEx’s revenue per package experienced a slight increase of 0.8% from 2018 to 2019, growing from $18.40 to $18.54.In 2020, revenue per package decreased by 1.3% to $18.30 compared to the previous year.The downward trend continued in 2021, with a decrease of 2.8% to $17.79 compared to 2020.However, in 2022, revenue per package increased substantially by 13.3% to $20.15, reversing the previous downward trend.UPS experienced a revenue growth of approximately 3.1% from 2018 to 2019, increasing from $71.86 billion to $74.09 billion.In 2020, the revenue showed a significant increase of 14.2% to $84.63 billion compared to the previous year.The upward trend continued in 2021, with revenue growing by 15% to reach $97.29 billion.In 2022, revenue increased by 3.1% to $100.33 billion, continuing the positive growth trend over the years.In 2019, UPS’s net income decreased by 7.3% compared to 2018, falling from $4.79 billion to $4.44 billion.The net income experienced a more significant drop in 2020, decreasing by 69.8% to $1.34 billion compared to the previous year.A substantial rebound occurred in 2021, with net income surging to $12.89 billion, representing an increase of 861% compared to 2020.In 2022, the net income decreased slightly to $11.55 billion, representing a decline of around 10.4% compared to the previous year.For the U.S. Domestic Package segment, the revenue in 2022 was $64.2 billion, with an operating profit of $6.99 billion.In the International Package segment, the 2022 revenue was $19.7 billion, while the operating profit reached $4.3 billion.In the Supply Chain Solutions segment, the revenue for 2022 was $16.43 billion, with an operating profit of $1.77 billion.In 2019, UPS’s average revenue per piece (ARP) slightly decreased by 0.3% compared to 2018, moving from $9.86 to $9.83.The ARP experienced a small increase of 0.9% in 2020, rising to $9.92 compared to the previous year.In 2021, the ARP saw a more significant growth of 11.5%, reaching $11.06 compared to 2020.In 2022, the growth trend continued, with the ARP increasing by 9.5% to $12.11 compared to the previous year, indicating an upward trend in the average revenue per piece.
The post UPS Average Daily Package Volume appeared first on FourWeekMBA.
UPS Cost Structure
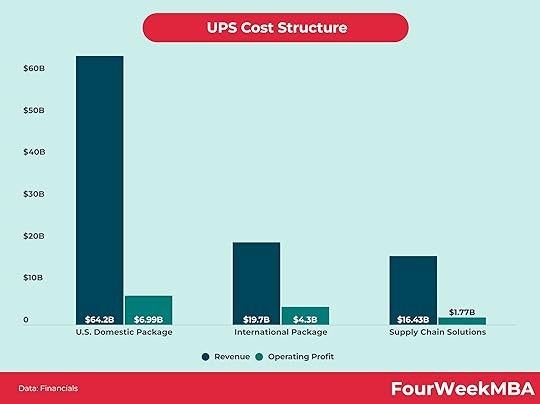 For the U.S. Domestic Package segment, the revenue in 2022 was $64.2 billion, with an operating profit of $6.99 billion.In the International Package segment, the 2022 revenue was $19.7 billion, while the operating profit reached $4.3 billion.In the Supply Chain Solutions segment, the revenue for 2022 was $16.43 billion, with an operating profit of $1.77 billion.Related Visual StoriesIn 2019, FedEx experienced a revenue growth of approximately 7.2% compared to 2018, increasing from $65 billion to $69.69 billion.Despite a slight decrease in 2020 to $69.22 billion, FedEx saw a substantial revenue growth of 21.3% in 2021, reaching $83.96 billion.The positive trend continued in 2022, with revenue increasing by 11.4% to $93.51 billion, showing consistent growth over the years except for 2020.FedEx experienced a significant drop in net income from $4.57 billion in 2018 to $0.540 billion in 2019, representing a decrease of approximately 88.2%.In 2020, net income rebounded to $1.28 billion, showing an increase of 137% compared to the previous year.The upward trend continued in 2021, with net income surging to $5.23 billion, which is a 308% increase compared to 2020.However, in 2022, net income decreased to $3.82 billion, a decline of around 27% compared to the previous year.Between 2019 and 2020, FedEx experienced an increase in the number of employees, with a growth of 2.5% from 239,000 to 245,000.In 2021, the company saw a more significant increase in employees, growing by 18% to reach 289,000.The upward trend in employee numbers continued in 2022, with an increase of 19.4%, bringing the total number of employees to 345,000.FedEx’s revenue per package experienced a slight increase of 0.8% from 2018 to 2019, growing from $18.40 to $18.54.In 2020, revenue per package decreased by 1.3% to $18.30 compared to the previous year.The downward trend continued in 2021, with a decrease of 2.8% to $17.79 compared to 2020.However, in 2022, revenue per package increased substantially by 13.3% to $20.15, reversing the previous downward trend.UPS experienced a revenue growth of approximately 3.1% from 2018 to 2019, increasing from $71.86 billion to $74.09 billion.In 2020, the revenue showed a significant increase of 14.2% to $84.63 billion compared to the previous year.The upward trend continued in 2021, with revenue growing by 15% to reach $97.29 billion.In 2022, revenue increased by 3.1% to $100.33 billion, continuing the positive growth trend over the years.In 2019, UPS’s net income decreased by 7.3% compared to 2018, falling from $4.79 billion to $4.44 billion.The net income experienced a more significant drop in 2020, decreasing by 69.8% to $1.34 billion compared to the previous year.A substantial rebound occurred in 2021, with net income surging to $12.89 billion, representing an increase of 861% compared to 2020.In 2022, the net income decreased slightly to $11.55 billion, representing a decline of around 10.4% compared to the previous year.For the U.S. Domestic Package segment, the revenue in 2022 was $64.2 billion, with an operating profit of $6.99 billion.In the International Package segment, the 2022 revenue was $19.7 billion, while the operating profit reached $4.3 billion.In the Supply Chain Solutions segment, the revenue for 2022 was $16.43 billion, with an operating profit of $1.77 billion.In 2019, UPS’s average revenue per piece (ARP) slightly decreased by 0.3% compared to 2018, moving from $9.86 to $9.83.The ARP experienced a small increase of 0.9% in 2020, rising to $9.92 compared to the previous year.In 2021, the ARP saw a more significant growth of 11.5%, reaching $11.06 compared to 2020.In 2022, the growth trend continued, with the ARP increasing by 9.5% to $12.11 compared to the previous year, indicating an upward trend in the average revenue per piece.
The post UPS Cost Structure appeared first on FourWeekMBA.
UPS Profits
 In 2019, UPS’s net income decreased by 7.3% compared to 2018, falling from $4.79 billion to $4.44 billion.The net income experienced a more significant drop in 2020, decreasing by 69.8% to $1.34 billion compared to the previous year.A substantial rebound occurred in 2021, with net income surging to $12.89 billion, representing an increase of 861% compared to 2020.In 2022, the net income decreased slightly to $11.55 billion, representing a decline of around 10.4% compared to the previous year.
 In the U.S. Domestic Package segment, net income increased by 65.3% from $3.89 billion in 2020 to $6.43 billion in 2021. In 2022, net income continued to grow, reaching $6.99 billion, an 8.7% increase compared to the previous year.The International Package segment saw its net income increase by 35.3% from $3.43 billion in 2020 to $4.64 billion in 2021. However, net income decreased by 7.3% to $4.3 billion in 2022.In the Supply Chain Solutions segment, net income experienced a significant increase of 384.3% from $0.357 billion in 2020 to $1.73 billion in 2021. The growth trend continued in 2022, with net income slightly increasing to $1.77 billion, a 2.3% increase compared to 2021.Related Visual StoriesIn 2019, FedEx experienced a revenue growth of approximately 7.2% compared to 2018, increasing from $65 billion to $69.69 billion.Despite a slight decrease in 2020 to $69.22 billion, FedEx saw a substantial revenue growth of 21.3% in 2021, reaching $83.96 billion.The positive trend continued in 2022, with revenue increasing by 11.4% to $93.51 billion, showing consistent growth over the years except for 2020.FedEx experienced a significant drop in net income from $4.57 billion in 2018 to $0.540 billion in 2019, representing a decrease of approximately 88.2%.In 2020, net income rebounded to $1.28 billion, showing an increase of 137% compared to the previous year.The upward trend continued in 2021, with net income surging to $5.23 billion, which is a 308% increase compared to 2020.However, in 2022, net income decreased to $3.82 billion, a decline of around 27% compared to the previous year.Between 2019 and 2020, FedEx experienced an increase in the number of employees, with a growth of 2.5% from 239,000 to 245,000.In 2021, the company saw a more significant increase in employees, growing by 18% to reach 289,000.The upward trend in employee numbers continued in 2022, with an increase of 19.4%, bringing the total number of employees to 345,000.FedEx’s revenue per package experienced a slight increase of 0.8% from 2018 to 2019, growing from $18.40 to $18.54.In 2020, revenue per package decreased by 1.3% to $18.30 compared to the previous year.The downward trend continued in 2021, with a decrease of 2.8% to $17.79 compared to 2020.However, in 2022, revenue per package increased substantially by 13.3% to $20.15, reversing the previous downward trend.UPS experienced a revenue growth of approximately 3.1% from 2018 to 2019, increasing from $71.86 billion to $74.09 billion.In 2020, the revenue showed a significant increase of 14.2% to $84.63 billion compared to the previous year.The upward trend continued in 2021, with revenue growing by 15% to reach $97.29 billion.In 2022, revenue increased by 3.1% to $100.33 billion, continuing the positive growth trend over the years.In 2019, UPS’s net income decreased by 7.3% compared to 2018, falling from $4.79 billion to $4.44 billion.The net income experienced a more significant drop in 2020, decreasing by 69.8% to $1.34 billion compared to the previous year.A substantial rebound occurred in 2021, with net income surging to $12.89 billion, representing an increase of 861% compared to 2020.In 2022, the net income decreased slightly to $11.55 billion, representing a decline of around 10.4% compared to the previous year.For the U.S. Domestic Package segment, the revenue in 2022 was $64.2 billion, with an operating profit of $6.99 billion.In the International Package segment, the 2022 revenue was $19.7 billion, while the operating profit reached $4.3 billion.In the Supply Chain Solutions segment, the revenue for 2022 was $16.43 billion, with an operating profit of $1.77 billion.In 2019, UPS’s average revenue per piece (ARP) slightly decreased by 0.3% compared to 2018, moving from $9.86 to $9.83.The ARP experienced a small increase of 0.9% in 2020, rising to $9.92 compared to the previous year.In 2021, the ARP saw a more significant growth of 11.5%, reaching $11.06 compared to 2020.In 2022, the growth trend continued, with the ARP increasing by 9.5% to $12.11 compared to the previous year, indicating an upward trend in the average revenue per piece.
The post UPS Profits appeared first on FourWeekMBA.


