
Gennaro Cuofano's Blog, page 175
January 24, 2021
DACI Decision-Making Framework
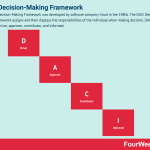
The DACI Decision-Making Framework was developed by software company Intuit in the 1980s. The DACI Decision-Making Framework assigns and then displays the responsibilities of the individual when making decision. DACI stands for driver, approver, contributor, and informed.
Understanding the DACI Decision-Making FrameworkIt is a group decision-making technique assigning roles and responsibilities to team members.
This includes identifying those who:
Must be consulted for further information.Must be tasked with conducting research, interviews, surveys, or polls.Must be informed once a decision has been made.Make, approve, or disapprove decisions.Follow or decide on recommendations.By clearly delineating roles and responsibilities, the DACI framework encourages collaboration and reduces friction. Ultimately, this increases the speed of project management, allowing teams to make informed and timely decisions crucial to success.
The four roles of the DACI Decision-Making FrameworkDACI is an acronym of four different group member roles that aid in simplifying decision-making.
Following is a look at each:
D – DriverThis is the individual who moves the decision making process forward. They ensure that decisions are made without necessarily making the decision themself on each occasion.
Drivers are tasked with setting decision timelines and ensuring that team activities run on schedule. They must also liaise with subject matter experts to make well-informed decisions.
A – ApproverThe approver has the final say on a project aspect. Many companies may have more than one approver, but they should be kept to a minimum to fully realize the DACI benefits of speed and simplicity.
C – ContributorA contributor is a person who influences decision making through specific knowledge or expertise. As a result, they act as consultants to drivers who then determine how that knowledge or expertise can be utilised.
I – InformedInformed individuals have no authority over decision making, nor are they directly involved in the project itself.
Nevertheless, their own work may be indirectly affected as the project progresses. For a team working on a new product, an informed group may encompass customer service, sales, and marketing. While these groups have no say on the final product, they should be regularly updated so that resource allocation and planning can progress accordingly.
Implementing the DACI Decision-Making FrameworkTeams that want to implement the DACI model should:
Determine the decision to be made. Here, the emphasis is on breaking the project down into smaller tasks and assigning a Driver to each. There should also be agreement on each action item and its associated outcomes.Define DACI roles. Then, assign roles such as Approver or Contributor to each member of the team using a spreadsheet. Ensure that every individual understands their role well. It’s also important to note that one individual can hold several roles if required.Define the workflow. At this point, the Driver begins developing the action plan. These plans should be broad and answer important questions. For example, who should attend meetings and how often will meetings occur once the project has begun? Will tasks be tracked by using a project management app, spreadsheet, or roadmap software? What will be the nature or structure of the decision-making process? In other words, will the Approver and Contributor have more say in decision making? Or will the project team as a whole collaborate directly with the Driver?Key takeaways:The DACI Decision-Making Framework clarifies roles and responsibilities for each member of a product development team to make better decisions.The DACI Decision-Making Framework is based on four key roles that comprise the DACI acronym: Drivers, Approvers, Contributors, and Informed.The DACI Decision-Making Framework is effective when projects are broken into smaller parts, with roles assigned to each. Before the project can begin, all members must understand and then agree upon their roles and responsibilities.Read Next: Business Analysis, Competitor Analysis, Continuous Innovation, Agile Methodology, Lean Startup, Business Model Innovation, Project Management.
Main Free Guides:
Business ModelsBusiness StrategyBusiness DevelopmentDigital Business ModelsDistribution ChannelsMarketing StrategyPlatform Business ModelsTech Business ModelThe post DACI Decision-Making Framework appeared first on FourWeekMBA.


CIRCLES Method And How To Use It To Get Hired
The CIRCLES Method is a framework that guides a complete and thoughtful response to any product design question. The CIRCLES Method is a framework of best practices that Google uses while interviewing candidates for product manager positions.
Understanding the CIRCLES MethodThe popular framework – which has been featured on Business Insider – helps candidates answer production design questions through mental cues.
These mental cues are based on fundamental principles of production design. This allows the candidate to respond in a thoughtful, persuasive, and composed fashion instead of saying whatever comes to mind.
Using the CIRCLES Method, the response will include important aspects of product management, including user empathy, prioritization, and problem definition.
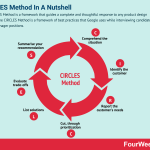
The seven stages of the CIRCLES MethodDuring the interview, the candidate is encouraged to move through seven stages. Each stage corresponds to a letter which make up the CIRCLES acronym:
C – Comprehend the situation. Begin by considering a few key questions. Who is the product designed for? Why do customers need it? How does it work? Where and when is it available? How does the business define customer satisfaction? Is satisfaction or another important metric failing to meet targets?I – Identify the customer. Be prepared and have a list of potential target audiences that will benefit from the product. Then, in the interview, choose one buyer persona that best supports your argument. To save time, consider illustrating a buyer persona using a simple matrix that describes user behaviours, needs, goals, and the demographic.R – Report the customer’s needs. This can be done by creating a user story to delve deeper and understand user needs and their intended benefits.C – Cut, through prioritization. Narrow the various needs of the customer down to one you feel will have the greatest impact. Think about how certain needs would be prioritized according to time, money, or other constraints. Here, a prioritization matrix or A/B testing is appropriate. This stage demonstrates to the interviewer that you can assess the pros and cons of different scenarios and think strategically. L – List solutions. For the identified need, list several solutions. Many candidates are great at identifying problems but have difficulty solving them. Brainstorming frameworks such as the Reversal Method and Attribute Method can help the candidate think on the spot. E – Evaluate trade-offs. Evaluation requires that the candidate be analytical, objective, and thoughtful. Trade-off criteria should be defined to better get your point across. Solutions should be analyzed via a pros and cons list. This stage is important because the ability to critique yourself is important in successfully responding to critique from others.S – Summarise your recommendation. Depending on how well your idea was presented, this last step may be unnecessary. Having said that, some organizations will want to assess your ability to concisely summarise a product proposal. In no more than 30 seconds, make a product or feature recommendation and reiterate why it is most beneficial to the user. In closing, clarify why your preferred solution is better than the others.Key takeaways:The CIRCLES Method is a framework that guides complete and thoughtful interview answers concerning product development and design.The CIRCLES Method is based on mental cues that represent fundamental principles of product design. Using the cues, the candidate being interviewed can give reasoned, persuasive, and structured answers.The CIRCLES Method is based on seven stages that make up the CIRCLES acronym. If the candidate moves through the first six stages with aplomb, the seventh evaluation stage may be unnecessary.Read Next: Business Analysis, Competitor Analysis, Continuous Innovation, Agile Methodology, Lean Startup, Business Model Innovation, Project Management.
Main Free Guides:
Business ModelsBusiness StrategyBusiness DevelopmentDigital Business ModelsDistribution ChannelsMarketing StrategyPlatform Business ModelsTech Business ModelThe post CIRCLES Method And How To Use It To Get Hired appeared first on FourWeekMBA.
ICE Scoring Model In A Nutshell
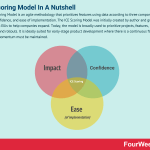
The ICE Scoring Model is an agile methodology that prioritizes features using data according to three components: impact, confidence, and ease of implementation. The ICE Scoring Model was initially created by author and growth expert Sean Ellis to help companies expand. Today, the model is broadly used to prioritize projects, features, initiatives, and rollouts. It is ideally suited for early-stage product development where there is a continuous flow of ideas and momentum must be maintained.
The three measurements of the ICE Scoring ModelPrioritization is achieved by considering three parameters which make up the ICE acronym.
Each parameter is rated on a scale of 1 to 10 which will be explained in more detail below.
1 – ImpactImpact is defined as the potential of a project feature to support core business or user objectives.
Impact is rated as follows:
1 – very low impact.2-5 – minimal impact.6-8 – measurable impact.9-10 – significant impact.2 – ConfidenceThis describes the degree to which project teams are confident the impact will be realized. Confidence can be rooted in gut instinct, but it’s better to back it up with hard data that quantifies known and unknown risk, for example.
Score confidence like this:
1 – very low confidence.2-5 – minimal confidence.6-8 – measurable confidence.9-10 – significant confidence.3 – Ease of implementationSimply put, how easily can the project feature be tested or completed? In other words, how long will it take to complete? Ease of implementation will ultimately be determined by the capabilities of the team and the resources available to them.
Each business will score ease of implementation differently, but as a general rule:
1-2 – long time frame (3-6 months)3-5 – significant time frame (2 months)6-7 – minimal time frame (1 month)8-10 – short time frame (2 weeks)Calculating and interpreting ICE scoresTo arrive at the ICE score, the team must rate each of the three parameters and then multiply them together. For example, a feature that scores 7 for impact, 5 for confidence, and 4 for ease of implementation receives a score of 140.
Alternatively, the team may choose to simply add the scores for each parameter to arrive at a final score. In either method, high scoring features should receive priority and the lowest scoring should be incorporated later or in some cases, not at all.
Strengths and weaknesses of the ICE Scoring Model
StrengthsSpeed and simplicity. With just three parameters to consider, the ICE Scoring Model allows teams to rapidly prioritize tasks and move forward with momentum and purpose.Avoids analysis paralysis. Sean Ellis intended for the ICE Model values to represent a “good enough” estimation. While it is perhaps less rigorous than some other models, it does allow project teams to avoid becoming preoccupied with details.Weaknesses:Prone to subjectivity. Parameter scoring is highly subjective. For example, how might a project team describe a confidence value of 8? In the worst case scenarios, the model may also be prone to bias. A worthwhile project feature requiring a lot of work may intentionally receive a lower score so that teams can avoid pursuing it.Requires broad expertise. Few people within an organization will have the expertise to score each parameter accurately. Ease of implementation is a technical consideration, while impact and confidence are business considerations.Key takeaways:The ICE Scoring Model prioritizes features or initiatives by scoring three key parameters: impact, confidence, and ease of implementation.The ICE Scoring Model is suited to early-stage product development where there is a flow of ideas and sustaining momentum is important.The ICE Scoring Model is a simple and reasonably accurate prioritization method. However, scores can be prone to bias as a result of subjectivity and a lack of requisite knowledge.Read Next: Business Analysis, Competitor Analysis, Continuous Innovation, Agile Methodology, Lean Startup, Business Model Innovation, Project Management.
Main Free Guides:
Business ModelsBusiness StrategyBusiness DevelopmentDigital Business ModelsDistribution ChannelsMarketing StrategyPlatform Business ModelsTech Business ModelThe post ICE Scoring Model In A Nutshell appeared first on FourWeekMBA.
Affinity Grouping And Wht It Matters In Business
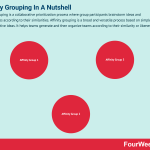
Affinity grouping is a collaborative prioritization process where group participants brainstorm ideas and opportunities according to their similarities. Affinity grouping is a broad and versatile process based on simple but highly effective ideas. It helps teams generate and then organize teams according to their similarity or likeness.
Understanding affinity groupingAffinity grouping can be used to:
Identify design improvements for an app.Classify information gathered via interviews, surveys, or general observations. For example, employee feedback.Create a diagram showing the relationship between factors influencing an issue or problem.The process begins with group members collaboratively brainstorming ideas or opportunities using Post-It Notes.
Then, each idea or opportunity is sorted according to thematic clusters called “affinity groups”. In business, these groups may have themes relating to driving revenue, increasing customer satisfaction, or enhancing performance.
Implementing the affinity grouping techniqueThe process of affinity grouping is neither formal nor overly structured. Nevertheless, teams should follow this basic order of steps:
Brainstorm ideas around a central issue or problem. Record each idea on a Post-It Note.Randomly place each idea on a large table or surface.Without deliberation, group ideas together if they appear to be related. Team members are free to add new ideas to the mix while grouping is occurring.Continue until all ideas have been grouped. Some ideas will have to be set aside because they don’t belong to a particular theme. At this stage, there should be no more than 10 groups formed.The team should then formulate short and descriptive sentences that describe each group. For best results, avoid one or two word titles. If descriptive sentences cause conflict with the ideas in one group, move certain ideas to another group or create copies so that one idea can occupy two groups.With each title, brainstorm some new ideas and classify them accordingly. Lastly, the group should determine which categories should be prioritized based on a vote.The role of the facilitator in affinity groupingAffinity grouping is a simple process, but it requires a reasonable degree of management.
A good facilitator is crucial in getting participants invested and maintaining that investment over meetings that can last hours.
Affinity grouping facilitators should also:
Clarify ground rules. It’s important to identify the team sponsor or the individual with the issue that needs to be addressed by the team. Team selection is also vital – each individual must have relevant expertise and be willing to engage in creative thinking.Maintain silence. Affinity grouping should be performed in silence, particularly when ideas are being generated and grouped. A good facilitator ensures that silence is upheld and that the dominant personality does not jeopardize the “democratic” nature of the technique.Clarify context and encourage ideas. The context must be established at the beginning of affinity grouping. This helps the technique stay focused on the matter at hand. Furthermore, all ideas should be encouraged and not dismissed before they’ve been analyzed.Key takeaways:Affinity grouping is a brainstorming method used to generate and organise ideas according to their likeness.Affinity grouping can be used to identify design improvements for an app, gather employee feedback, or show the relationship between factors as they contribute to a problem.Affinity grouping does require the services of a good facilitator who clarifies ground rules and context. They also ensure that the process is performed in silence so that dominant personalities do not compromise results.Read Next: Business Analysis, Competitor Analysis, Continuous Innovation, Agile Methodology, Lean Startup, Business Model Innovation, Project Management.
Main Free Guides:
Business ModelsBusiness StrategyBusiness DevelopmentDigital Business ModelsDistribution ChannelsMarketing StrategyPlatform Business ModelsTech Business ModelThe post Affinity Grouping And Wht It Matters In Business appeared first on FourWeekMBA.
Value vs. Complexity Framework
The Value vs. Complexity framework is a prioritization model. It allows product teams to evaluate ideas based on how much value they add and how difficult they are to implement. The Value vs. Complexity framework helps businesses prioritize product feature lists during development.
Understanding the Value vs. Complexity frameworkIn an ideal world, features that provide the most value to the business and customer are rolled out first. But this process ignores their inherent complexity. In other words, how much time, effort, or cost is associated with rolling out each feature?
The Value vs. Complexity framework helps product managers objectively allocate resources to a product initiative based on its perceived benefit. Indeed, the framework offers a standardized decision-making process for many parameters, including product enhancements and fixes.
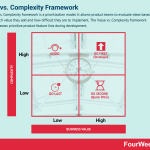
Completing a Value vs. Complexity analysisTo determine which initiatives to shelve and which to move ahead with, the product team must create a matrix of four equal squares. On the y-axis, value is represented from low to high. On the x-axis, complexity (of implementation) is represented from low to high.
For each feature being considered, the team must then consider the:
Anticipated value. For example, will the initiative reduce user pain or improve efficiency? Does it add value to the business through customer acquisition or retention? Will the initiative enhance brand image? Will it impact a large enough audience to make it viable? Value can also be assessed by considering how urgently the market wants it.The effort required to realize this value. Complexity may include operational costs, developer hours, customer or employee training, and risk.For both axes, the business must determine a consistent and weighted scoring system according to how important it deems each feature attribute.
Then, each feature is plotted on the matrix in one of four quadrants:
High value/low complexity – initiatives falling into this quadrant are the top priority. Though it is worth noting that most of the tasks occupying this category have likely been completed already.High value/high complexity – initiatives in the second quadrant have the potential to deliver high value, but their complexity prohibits their implementation. On occasion, these initiatives may be broad, strategic initiatives that require a long-term investment of time and money.Low value/low complexity – these initiatives are low value, but they may still represent desirable features, nonetheless. Their low complexity makes them attractive to product teams, particularly during transitional periods between projects.Low value/high complexity – or initiatives that should be avoided completely. This is one of the core strengths of the Value vs. Complexity framework, helping businesses identify initiatives that are likely to represent low ROI.Key takeaways:The Value vs. Complexity framework is a feature prioritization model based on the likely value and complexity of implementation of each feature.The Value vs. Complexity framework allows product managers to implement a standardized, objective decision-making process for new initiatives.The Value vs. Complexity framework is represented on a matrix of four quadrants. Using a weighted, customized scoring system, a business determines which initiatives are worthy of further exploration.Read Next: Business Analysis, Competitor Analysis, Continuous Innovation, Agile Methodology, Lean Startup, Business Model Innovation, Project Management.
Main Free Guides:
Business ModelsBusiness StrategyBusiness DevelopmentDigital Business ModelsDistribution ChannelsMarketing StrategyPlatform Business ModelsTech Business ModelThe post Value vs. Complexity Framework appeared first on FourWeekMBA.
January 23, 2021
Toyota Production System In A Nutshell
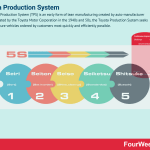
The Toyota Production System (TPS) is an early form of lean manufacturing created by auto-manufacturer Toyota. Created by the Toyota Motor Corporation in the 1940s and 50s, the Toyota Production System seeks to manufacture vehicles ordered by customers most quickly and efficiently possible.
Understanding the Toyota Production SystemThe TPS is based on underlying principles called the Toyota Way:
Continuous improvement Challenge – or the courage and creativity to meet challenges and realize their long-term vision.Kaizen – or the continuous improvement of business operations.Genchi Genbutsu – which advocates going to the source to fact-find and make informed decisions.Respect for people.Respect – every effort is made to respect and understand each other. This means taking ownership of personal work and building mutual trust.Teamwork – employees must be stimulated to achieve personal and professional growth. Opportunities for such growth should be shared throughout the organization to maximize performance.The two core concepts of the Toyota Production SystemToyota bases its philosophy on two concepts:
“Jikoda” – a Japanese word loosely translated to “automation with a human touch”. For Toyota, this means that automated systems (machines) must be built and improved by hand until they are reliable and safe. Machines built by hand to very high standards become simpler to use and less expensive to run. This results in simple, slim, flexible, and lean manufacturing processes that are adaptable to fluctuating production volume.The “just-in-time” (JIT) concept – where each part of the manufacturing process produces what is needed for the next process to facilitate continuous flow and improve productivity. Toyota describes the JIT concept as making only “what is needed, when it is needed, and in the amount needed.”The three categories of waste products in the Toyota Production SystemIn the introduction, we noted that the elimination of waste was integral to lean manufacturing at Toyota.
Waste that can potentially hinder process improvement is divided into three categories.
“Mura”Mura is translated as unevenness, non-uniformity, and irregularity. When a production line work station has a higher capacity than other stations, waste in the form of overproduction and delay-causing bottlenecks occur. Muri can be mitigated by using Kanban or Just-In-Time manufacturing to limit the accumulation of excess inventory.
“Muri”Muri encompasses overburden, excessiveness, unreasonableness, or something that is beyond one’s power. Muri is evident when machines or human operators are forced to work beyond their capacity. Machines inevitably fail, causing delays and costing money. Overworked employees cause a lack of productivity owing to illness and absenteeism.
“Muda”Muda is defined as wastefulness, uselessness, and anything that hinders the creation of value that the customer is willing to pay for. Muda Type 1 processes do not add value directly but are required by law – such as the passing of safety tests and emissions standards. However, Muda Type 2 processes are non-value-adding activities that are also unnecessary.
These activities are further categorized into seven types of waste:Transport – or wastage resulting from the excess or unnecessary movement of people, tools, equipment, or products.Inventory – excess inventory can lead to an inefficient allocation of capital or occupy valuable space that could be better utilized elsewhere. Large amounts of stock sitting idle is also prone to damage or spoilage. Here, defects are also more difficult to detect and address.Motion – this is wastage that results from walking, lifting, reaching, double-handling, and so forth. Motion should be limited or redesigned to increase occupational health and safety and improve productivity.Waiting – this includes people waiting for materials or equipment. It also includes equipment waiting because of input delays caused by uneven production.Overproduction – or the manufacturing of a product or component before it has been asked for, required, or ordered. This results in excess inventory and increases lead-time.Over-processing – defined as doing more work or adding more product features or steps than is necessary. In manufacturing, this might encompass the over-engineering of a solution or adjusting a component after it has been installed.Defects – or products not fit for use that must be scrapped or reworked. Both outcomes require an extra allocation of resources which reduces productivity and profit margins.Key takeaways:The Toyota Production System is a pioneering form of lean manufacturing developed by the Toyota Motor Corporation.The Toyota Production System is based on continuous improvement and respect for people. In manufacturing, it favors just-in-time (JIT) production and automation with a human touch.The Toyota Production System categorizes waste into three categories: Muri, Muda, and Mura. Each category is defined by specific adjectives that clarify potential sources of process inefficiency.Read Next: Business Analysis, Competitor Analysis, Continuous Innovation, Agile Methodology, Lean Startup, Business Model Innovation, Project Management.
Main Free Guides:
Business ModelsBusiness StrategyBusiness DevelopmentDigital Business ModelsDistribution ChannelsMarketing StrategyPlatform Business ModelsTech Business ModelThe post Toyota Production System In A Nutshell appeared first on FourWeekMBA.
January 21, 2021
Amazon Working Backwards Method
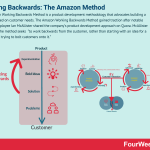
The Amazon Working Backwards Method is a product development methodology that advocates building a product based on customer needs. The Amazon Working Backwards Method gained traction after notable Amazon employee Ian McAllister shared the company’s product development approach on Quora. McAllister noted that the method seeks “to work backwards from the customer, rather than starting with an idea for a product and trying to bolt customers onto it.”
Understanding the Amazon Working Backwards Method Customer obsession goes beyond quantitative and qualitative data about customers, and it moves around customers’ feedback to gather valuable insights. Those insights start with the entrepreneur’s wandering process, driven by hunch, gut, intuition, curiosity, and a builder mindset. The product discovery moves around a building, reworking, experimenting, and iterating loop.
Amazon CEO Jeff Bezos later admitted that while the method was resource intensive, it saved a lot of work later in the product development process. “The Working Backwards Process is not designed to be easy, it is designed to save a huge amount of work on the backend, and to make sure we are building the right thing”, said Bezos.
A fundamental principle of Amazon’s method is that the product team must imagine the product is ready to ship. This entails the drafting an imaginary press release. In the next section, we will discuss this core component of Amazon’s method in more detail.
The Amazon Working Backwards Method press releaseAmazon gives the product team flexibility to draft the press release in any manner they see fit.
However, McAllister noted that it should occupy a page and a half or less and be broken down into short paragraphs of three to four sentences.
It must also contain certain elements, including a:
Heading – containing the product name in a form that will resonate with the customer.Sub-heading – concisely describing the intended customer or target audience in no more than a sentence.Summary – or a brief product summary focusing on the benefits the product will deliver to the customer. Product teams should assume that the reader will focus most of their attention here, so the summary must be high quality.Problem – identifying a problem and then describing how the product in question offers a solution.Solution – how does the product solve the problem in practice? The language must be relatable and not use technical jargon.Quote – include an inspirational quote from a company representative explaining the reasons for developing the product. The company should also detail what they hope the customer will gain by using the product. Is it extra time or money? Perhaps it is related to confidence or an increased feeling of autonomy?Call to action – it is important to direct the customer to take advantage of the new product.Testimonial – since the product has not been created yet, the team must create a hypothetical testimonial. Focusing on the benefits of the product is recommended first and foremost.FAQ – or a similar addendum answering common questions or concerns. This feature is optional.The benefits of the Amazon Working Backwards MethodAmazon’s method helps decision makers become more emotionally intelligent. Product teams often become emotionally attached to unviable ideas. Without proper due diligence, these teams find it difficult to let go of ideas and spend vast amounts of time and money trying to make them work.
By drafting a mock press release, the team is forced to flesh out and then refine an idea in detail. This makes idea legitimacy more apparent because teams are forced to clarify whether their intentions are aligned with customer needs. With a more objective approach, decisions are based on thoughtful and considered research and analysis.
If a product does progress to development, a well-crafted press release helps the product team stay on track and avoid scope creep.
Key takeawaysThe Amazon Working Backwards Method is a product development framework where teams create hypothetical products based on real customer needs.Central to The Amazon Working Backwards Method is the creation of a press release announcing the release of the product. The press release must demonstrate that the company has a sound grasp of its target audience and their particular needs, among other things.The Amazon Working Backwards Method enhances the emotional intelligence of product teams. Crafting a press release removes emotional attachment from product design and avoids low viability ideas being pursued indefinitely.More About Amazon:
Amazon Business ModelWhat Is the Receivables Turnover Ratio? How Amazon Receivables Management Helps Its Explosive GrowthAmazon Case Study: Why from Product to Subscription You Need to “Swallow the Fish”What Is Cash Conversion Cycle? Amazon Cash Machine Business Model ExplainedWhy Is AWS so Important for Amazon Future Business Growth?Amazon Flywheel: Amazon Virtuous Cycle In A NutshellAmazon Value Proposition In A NutshellWhy Amazon Is Doubling Down On AWSThe Economics Of The Amazon Seller Business In A NutshellHow Much Is Amazon Advertising Business Worth?What Is the Cost per First Stream Metric? Amazon Prime Video Revenue Model ExplainedJeff Bezos Teaches You When Judgment Is Better Than Math And DataAlibaba vs. Amazon Compared in a Single InfographicAmazon Mission Statement and Vision Statement In A NutshellRead Next: Business Analysis, Competitor Analysis, Continuous Innovation, Agile Methodology, Lean Startup, Business Model Innovation, Project Management.
Main Free Guides:
Business ModelsBusiness StrategyBusiness DevelopmentDigital Business ModelsDistribution ChannelsMarketing StrategyPlatform Business ModelsTech Business ModelThe post Amazon Working Backwards Method appeared first on FourWeekMBA.
The User Is Drunk And Why It Matters In Business
The User Is Drunk is a UX design and product management concept that advocates designing simple and straightforward products. The User Is Drunk concept is the brainchild of UX designer and developer Richard Littauer who noted that “your website should be so simple, a drunk person could use it.” To that end, design teams must assume that drunk users need help with the most simple of tasks. Then, they must strive to make it impossible for them to fail.
Understanding The User Is DrunkThe User Is Drunk concept is the brainchild of UX designer and developer Richard Littauer who noted that “your website should be so simple, a drunk person could use it.” To that end, design teams must assume that drunk users need help with the most simple of tasks. Then, they must strive to make it impossible for them to fail.
Seeing the value in Littauer as a web designer who likes to drink, companies then hired him to review their products or websites while under the influence of alcohol. He has now worked with over 50 organizations, including Gizmodo, HubSpot, VWO, and Shopify.
In the next section, we will discuss what Littauer learnt as a drunk user and how product managers and designers can benefit.
Two core concepts of The User Is Drunk
Concept 1 – Keep it simpleProduct or design teams naturally become very familiar with their projects, but this familiarity can come at the expense of objectivity. How might an inebriated user find their way around a website or app?
At the very least, a drunk user will experience difficult navigating and finding the things they need. In fact, they should be treated the same as a completely new user. Wherever possible, teams should remove, refine, or rework steps to ensure the drunk user experience is as seamless and inviting as possible.
Concept 2 – Assume that the user is distractedLittauer argues that many UX teams design products with the assumption that every user will give them their full attention.
However, most people use apps or browse websites in a state of distraction that is often exacerbated by alcohol. Therefore, it is important to ensure that product or website design makes allowances for drunk users who are unable to devote 100% of their mental energy toward a task.
In other words, navigating an app or website should only require partial focus and mental aptitude.
Three mistakes that websites make for drunk usersAccording to Littauer, these are the mistakes websites make that could potentially result in users clicking away:
Dark UX patterns. Drunk users are especially sensitive to newsletter sign-up requests and chat pop-ups that try to push them in a certain direction.Excessive text. In a distracted state and with a shorter attention span, drunk users are highly unlikely to read walls of text.Red and green colours. Littauer is color blind, so these colours make navigation harder. But he argues that many websites do not cater for users with disabilities, and these shortfalls become irritating quickly when drunk.Key takeaways:The User Is Drunk is a user design and product development framework that favours simplicity. It works on the assumption that drunk users will need help in achieving the simplest of tasks.The User Is Drunk is based on two core concepts. Teams must be focused on simplicity and objectivity and assume that a drunk user is highly distracted.The User Is Drunk creator Richard Littauer notes that drunk users are especially sensitive to Dark UX patterns, excessive text, and sites that do not cater for disabilities.Read Next: Business Analysis, Competitor Analysis, Continuous Innovation, Agile Methodology, Lean Startup, Business Model Innovation, Project Management.
Main Free Guides:
Business ModelsBusiness StrategyBusiness DevelopmentDigital Business ModelsDistribution ChannelsMarketing StrategyPlatform Business ModelsTech Business ModelThe post The User Is Drunk And Why It Matters In Business appeared first on FourWeekMBA.
HEART Framework And Why It Matters In Business
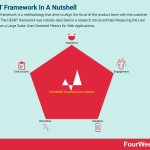
The HEART framework is a methodology that aims to align the focus of the product team with the customer experience. The HEART framework was initially described in a research article entitled Measuring the User Experience on a Large Scale: User-Centered Metrics for Web Applications.
Understanding the HEART frameworkThe article entitled “Measuring the User Experience on a Large Scale: User-Centered Metrics for Web Applications,” which was written by a team of UX researchers at Google, noted that “there is a strong need for user-centered metrics for web applications, which can be used to measure progress toward key goals, and drive product decisions.”
Google also noted that while measuring small scale user experience was relatively simple, no framework existed to automate user experience management on a large scale. To fill this gap, the HEART framework was born.
The five core metrics of the HEART frameworkHEART is an acronym representing five core metrics. Each metric focuses on the way in which a user engages with a product.
The five metrics are:
Happiness. How do users feel about the product? In large projects, happiness is measured through surveys evaluating user satisfaction, ease of use, visual appeal, or net-promoter score (NPS).Engagement. To what extent are users engaging with the product? Here, extent describes the frequency, intensity, or depth of interaction over a predefined period. Engagement encompasses a broad range of metrics including the number of repeat visits, uploads, shares, or views.Adoption. How many customers are completing the onboarding process? Alternatively, how many users are upgrading to the latest version to enjoy new product features? Retention. What percentage of customers are return customers? Retention metrics include the number of active users, repeat purchases, and renewal rate. Customer retention is a critical metric of the HEART framework because it helps businesses avoid customer churn.Task success. Task success measures standard behavioural metrics of the user experience. Tasks themselves may include finding information from search results or completing a profile page. But success is determined by the efficiency or effectiveness with which tasks can be completed. In other words, is page load speed fast enough to satisfy the user? How many errors were encountered during the task? Is task performance intuitive or user-friendly?Implementing the HEART frameworkThe HEART framework incorporates the relatively conventional “Goals-Signals-Metrics” (GSM) business concept:
Goals – or critical tasks that the user needs or wants to accomplish. It’s important that the business narrows down a list of goals to no more than three. To help prioritize goals, Google UX researchers ask themselves: “What do we want a customer to tweet after using our product?”Signals – which encompass specific states that represent success or failure. Put differently, what behaviour would users exhibit if they could perform an action successfully? What behaviour would be exhibited if they couldn’t? Metrics – these measure goals and signals over time to quantify progress that is made in creating the user experience. As progress is made and the user base grows, it’s important to normalise data by using ratios, averages, and percentages. Metrics are similar to goals in that too many can become unmanageable. Instead, teams should only track metrics that help them make UX decisions.Teams can better understand the interaction of goals, signals, and metrics, by plotting them against each of the five HEART metrics in a matrix.
Ultimately, this helps the business integrate behavioural and attitudinal data into something that can be scaled.
Key takeawaysThe HEART framework was developed by Google to align the focus of the product team with the customer experience. The framework allows organizations to automate user experience management on a large scale.The HEART framework is based on five core metrics: happiness, engagement, adoption, retention, and task success. Each is focused on the product-user interaction.The HEART framework is woven into the more conventional “Goals-Systems-Metrics” (GSM) concept. Each core metric and associated GSM characteristics can be displayed in a matrix to help teams scale user experience management.Read Next: New Product Development, Storyboarding, Story Mapping, Business Analysis, Competitor Analysis, Continuous Innovation, Agile Methodology, Lean Startup, Business Model Innovation, Project Management.
Main Free Guides:
Business ModelsBusiness StrategyBusiness DevelopmentDigital Business ModelsDistribution ChannelsMarketing StrategyPlatform Business ModelsTech Business ModelThe post HEART Framework And Why It Matters In Business appeared first on FourWeekMBA.
Impact Mapping And Why It Matters In Business
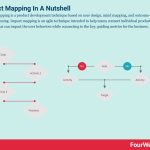
Impact mapping is a product development technique based on user design, mind mapping, and outcome-driven planning. Impact mapping is an agile technique intended to help teams connect individual product features that can impact the user behaviors while connecting to the key, guiding metrics for the business.
Understanding Impact MappingMany product teams understand the importance of outcomes but nevertheless succumb to prioritising the development of much more tangible features.
Impact mapping was designed to help these teams gain clarity on outcomes that are comparatively hard to measure or appreciate. It is a collaborative methodology that seeks to help agile teams connect individual features to behaviours worth changing – all the while satisfying metrics that matter to the business.
Impact mapping combines elements of mind mapping and strategic planning and is prevalent among start-ups and large enterprises alike. Over the years, it has been adapted for use in:
Facilitating innovation workshops.Aligning stakeholders with legacy enterprise projects.Software delivery process improvement.Instituting organizational-wide improvement.Testing strategy definition.The four key questions of Impact MappingFour key questions in the form of levels help stimulate conversation during product development. This conversation forms the basis of a visual and structured mind-map.
The fifth and final level is not based on a question but instead on validating the solutions arrived it in the first four levels.
Let’s take a look at each below.
Level 1 – Why are we doing this?In other words, what goal is the project trying to achieve in the form of an objective? Why is this goal worth pursuing? The “why” can be made more tangible by articulating ambition. What is the timing of the goal and what difference does it seek to create?
For example, a business may have an ambition to increase average Net Promoter Score from 7 to 8 in the next 12 months.
Level 2 – Who can bring the organization closer to an objective? Alternatively, who might prevent the organization from achieving that objective?Who are the actors who have the potential to impact the outcome? Identifying the most obvious actors is easy, but the real value lies in uncovering “second-degree” actors. In addition to external actors such as customers, consider internal actors such as key stakeholders, marketing, customer service, and administrative support roles.
Level 3 – How should the behaviour of actors change?Put differently, how does behaviour have to change to change the overall impact? This is the part that many organizations struggle with. Indeed, actors will not voluntarily change their behaviour so that the business can become more profitable.
Insight into behavioural outcomes needs to be earnt through rigorous qualitative and quantitative research. The pains and gains of the current actor workflow must be well understood to selectively identify behaviours worth changing. Does the outcome need to be higher, lower, faster, or slower?
Outcomes should always be reframed as a challenge. If an actor wants to purchase event tickets without calling a call centre, the team can reframe it as: “How might we enable event participants to purchase tickets from their smartphone?”
Reframing also helps product teams avoid reverting to discussing specific features out of habit.
Level 4 – What can the product team do to support the desired impacts?Now is the time to consider the features (deliverables) that will support an outcome. This can be achieved by running cross-functional ideation sessions involving stakeholders from across the company.
Note that the inclusion of a feature on the map does not stipulate that it must be executed. The primary goal here is to create a list of potential courses of action.
For the previous example of an event goer ordering tickets without calling a call centre, the actor is most likely to be a smartphone app that sells tickets. Here, the outcome that alters customer behaviour is a more convenient means of ordering tickets. Ultimately, a successful outcome signifies that the business has reached its objectives and made an impact.
Level 5 – Determining whether the solution is worth implementingSolutions must be validated through qualitative and quantitative experiments. Importantly, multiple experiments should consider every aspect of the solution, from feasibility to validity to usability.
Then, worthwhile solutions can be prioritized using a framework such as the ICE Scoring Model.
Key takeaways:Impact Mapping combines mind mapping and strategic planning to help teams identify behaviours that will help them reach their objectives.Impact Mapping is a popular and successful framework used in small and large businesses. It is most prevalent in software development but can also be seen in organization-wide improvement and stakeholder alignment with legacy systems.Central to Impact Mapping is the collaborative creation of a visual mind-map based on four key questions that stimulate conversation and develop potential solutions. The fifth level then instructs product teams to evaluate and prioritize solutions based on experimentation.Read Next: New Product Development, Storyboarding, Story Mapping, Business Analysis, Competitor Analysis, Continuous Innovation, Agile Methodology, Lean Startup, Business Model Innovation, Project Management.
Main Free Guides:
Business ModelsBusiness StrategyBusiness DevelopmentDigital Business ModelsDistribution ChannelsMarketing StrategyPlatform Business ModelsTech Business ModelThe post Impact Mapping And Why It Matters In Business appeared first on FourWeekMBA.


