Daniel M. Russell's Blog, page 39
August 26, 2019
Answer: What's your favorite geo-mapping / geo-information tool? (Part 1/2)
LOTS of comments this week...
... as Regular SRS Readers chimed in with great suggestions for their favorite geo-resources.
 The new Google Earth on the web (https://www.google.com/earth/) is a fantastic
geo-located information resource.
We had two parts to this Challenge, but the first part is HUGE... and I'm still working on it, which is why I'm so slow in writing up an answer this week. I'm going to write up my answer to Challenge #1 tomorrow.
1. (knowledge) What's your favorite geo-information resource? It could be something we've already talked about (like Earth, Maps, Streetview, or Wikimapia), or you teach us all something about a resource that you use and enjoy. What is it? Why do you think it's great?
When I look at the long list of suggestions, I realize that there are LOTS of possible geo-resources. See the next post tomorrow....
2. (skill) Can you find a NEW geo-information (or geo-mapping, or geo-indexed anything!) resource? What process did you follow to find it?What I was looking for here were some ideas about how to DISCOVER new geo-information resources. How do you do that? Here are the collected strategies of some SRS Regular Readers:
Jon suggested the query:
[NEW geo-information]
... which gives lots of suggestions. (Especially nice, the lists of resources.) Worth exploring!
Arthur Weiss suggested:
["google fusion tables"]
... as a way to find alternatives to the geo-capabilities of Fusion Tables.
Ramón gave us a link to Simon Kuestenmacher:
[ Simon Kuestenmacher ]
... which leads to a bunch of the resources he's developed (or written about), such as his Twitter Feed.
Abstracting these ideas
These are great tactics, but I want to abstract them just slightly and turn them into real strategies.
1. Searching for new resources: A great way to find the latest resource (of any type) is to search for:
[ new kind-of-resource ]
Such as:
[ new geography data set ]
[ new mapping resources ]
etc.
But problem with this approach is that many sites will title a page with "new"... and then leave it up on their site for years, constantly advertising that it's "new"!
A great way to get just the truly new stuff is to use the operator after: -- like this:
[ mapping resources after:1-1-2016 ]
The after: operator is relatively new, and lets you filter out everything before the specified date. Notice that I removed "new" from the query since it's redundant. (Anything after 2016 is defined to be new!) Google also has the before: operator, which does the obvious thing.
2. Search alternative names: Jon's use of the search term "geo-information" is great, and suggests a strategy for finding even more resources--look around for terms OTHER than what you'd immediately think of at first blush. (For instance, geospatial, geographic, mapping, etc.) When I did the search for synonyms:
[ synonyms geo-information ]
as I looked through the results, I found the term USGS , which isn't a synonym, but a REALLY useful search term that will lead to productive search results. Like this:
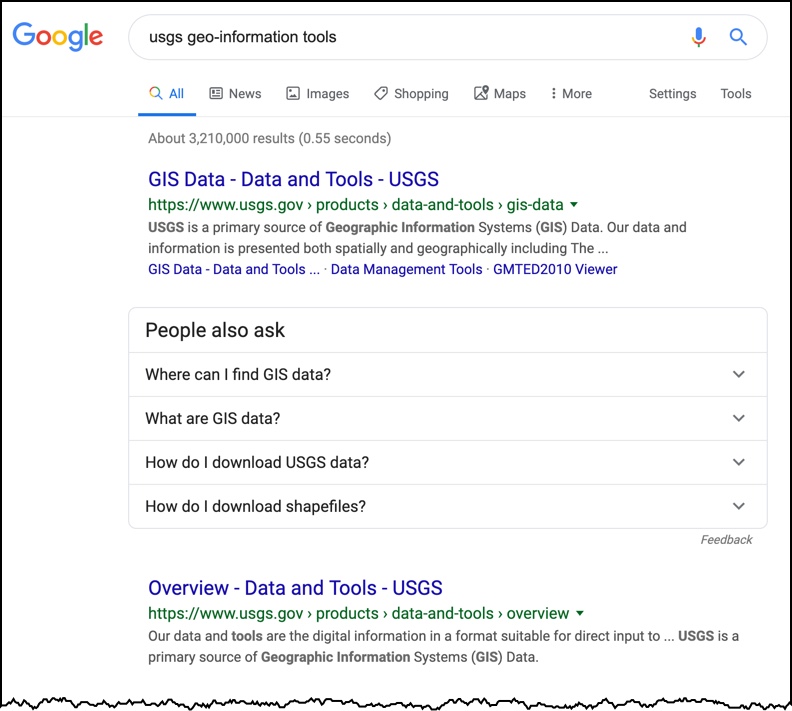
Or this...
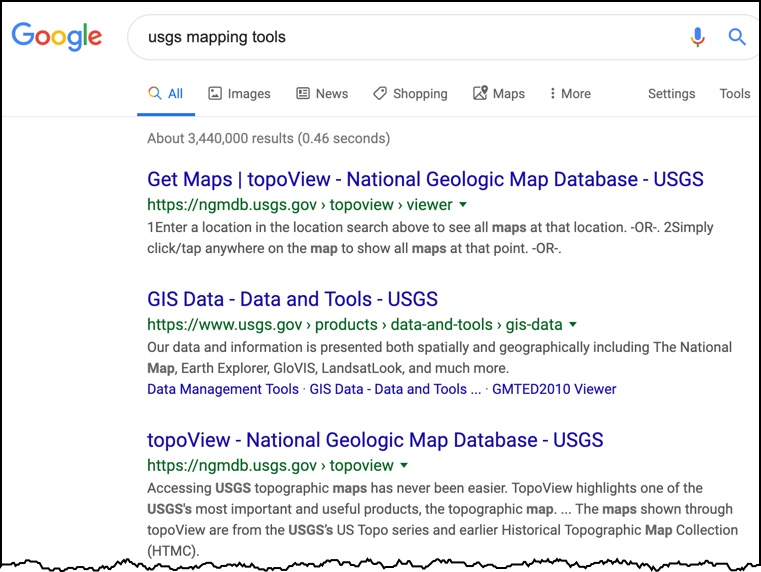
And if you want to see the latest, use after: to limit the results to the most recent.
3. Follow people with aligned interests: Often people will indulge their interests online in ways that are incredibly useful to others, especially if you're not part of that field. Ramón found this guy, Simon Kuestenmacher (or his site), who is VERY much a geo-information / geo-tools guy (among other things).
As a strategy, looking for people who are deeply into a topic (and then looking at their trail of postings on Twitter / Facebook / Web) often leads to fantastic resources. Just a quick glance at Simon's posting leads to all kinds of marvelous maps, animations... and the tools and resources that he uses in his work.
One example. Simon posted a marvelous Greenland animated GIF showing the effect of Mercator map projection distortion (see below, credit:@neilrkaye):
which led me to find the tool used to make this: TrueSize, which lets you compare the size of any two countries, such as Greenland and Mexico (which are, remarkably enough, almost the same size).
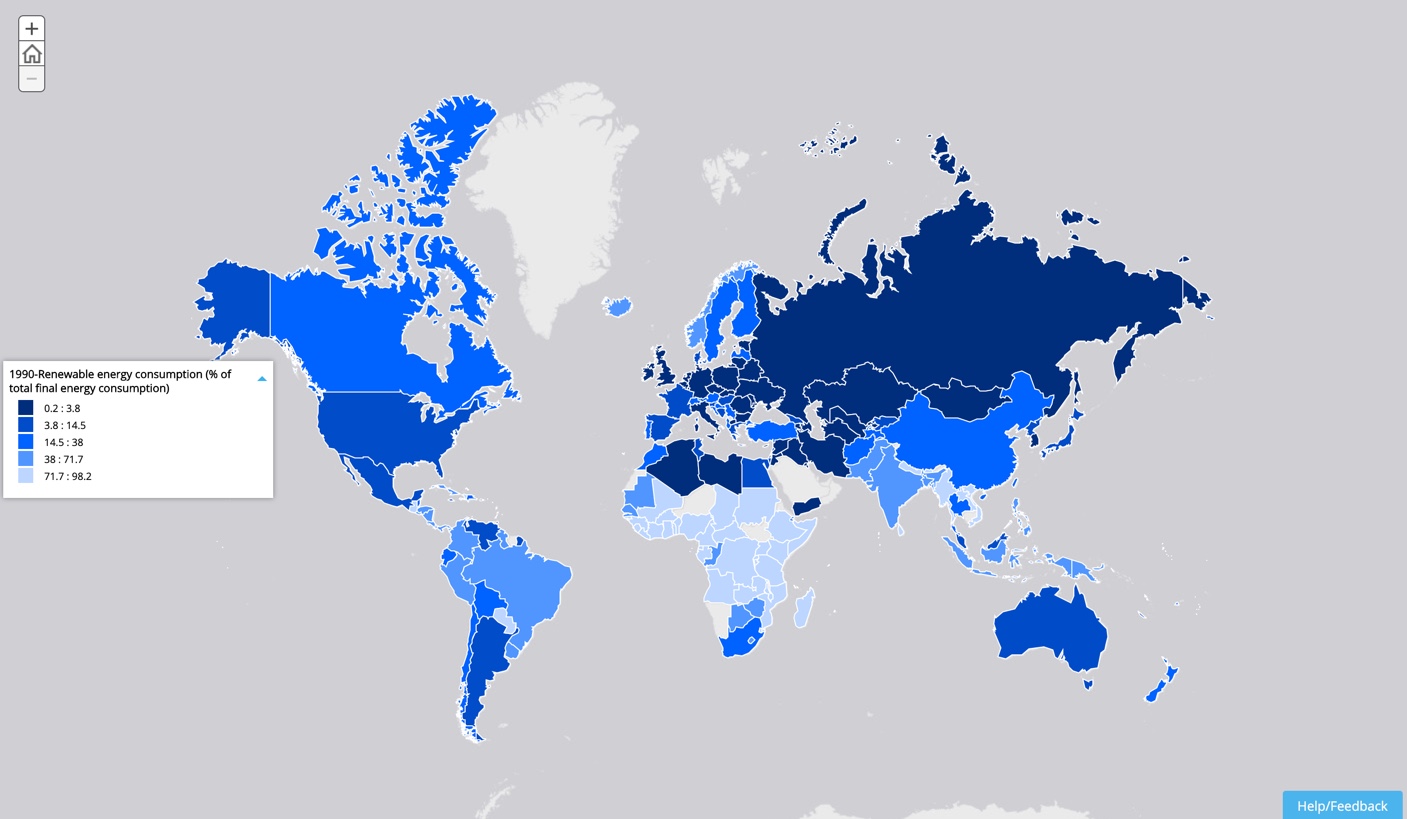
Once you start working forward from interesting people, you can find all manner of useful connections. It was this way that I found a link to Exploring the Invisible, which in turn led me to data sets from the World Bank, and handy ways to create your own maps from their data sets, such as this map of worldwide renewable energy resources (below).
Search Lessons
There are ways you can improve your searching by making better queries, but there are ALSO ways to improve your searching by expanding the range of things you consider. We've covered a few methods...
1. Search for new resources by explicitly looking for "new" or newly posted content. You can add "new" or "latest" (or similar) to your query, and that will give you that kind of results.
2. Search for another way to express what you're seeking. In the topic of "interesting geo-information," there are MANY ways to say this. If you search for synonyms or alternative ways of expressing your target, you can enrich what you find.
3. Search for a person (or institution) that's aligned with your interests, and follow what they're writing about. You can learn much from the other things they write about. In this case we looked for a person with geo- mapping- data- interests, but this same idea works with nearly any topic. (Give it a try with "medieval music" or "Southwest lizards." As a friend once said to me, "This is the internet, Dan, there's someone who's deeply interested in anything...").
Tomorrow, a few of the geo-information resources that we found.
Search on!


August 14, 2019
SearchResearch (8/14/19): What's your favorite geo-mapping / geo-information tool?
You might have noticed...
... lots of the SearchResearch Challenges involve finding other resources--like mapping sites--and then using them to help answer the Challenge-of-the-Week.
The new Google Earth on the web (https://www.google.com/earth/) is a fantastic geo-located information resource.
An important set of things to know is WHAT resources are available...
... and ...
An important skill for any powerful SearchResearcher is the ability to FIND those sources.. and find new resources that you don't know about ahead of time.
So this week's Challenge comes in two parts. Both are a little meta, but together, I hope they teach a powerful lesson.
1. (knowledge) What's your favorite geo-information resource? It could be something we've already talked about (like Earth, Maps, Streetview, or Wikimapia), or you teach us all something about a resource that you use and enjoy. What is it? Why do you think it's great?
2. (skill) Can you find a NEW geo-information (or geo-mapping, or geo-indexed anything!) resource? What process did you follow to find it?
In both cases, we're looking for Open-Access resources. (I'll also take something that's really really inexpensive.)
What do you know about? What can you find?
Be sure to let us know what you did to find your NEW favorite geo-resource!!
Here's one example, an animated GIF I made from Google Earth (web) showing movement in Yosemite Valley.
Search on!
August 8, 2019
Answer: Are there seals in Tahiti?
Okay... by now I'm almost back into
my Californian mindset...
... but our Challenge from last week still remains. Remember, I asked:
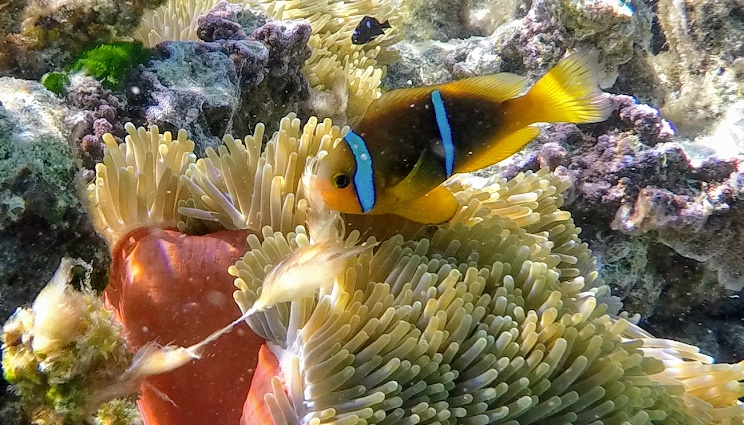
While there, I saw lots of wildlife. Such as this anemonefish I found on Raiatea,
1. Is it true there are no seals or sea lions in Tahiti? If so why not? (Or did I just miss them?)
How would you do online research for a question like this? Remember that doing an obvious query like:
[ seals OR "sea lions" in Tahiti ]
is biasing the results towards ANYTHING that mentions seals or sea lions in Tahiti. (If you do this query, you'll find a sad story about a little seal who showed up in Raivavae in August, 2016. (Unfortunately, it was so far from home that it didn't survive.)
You'll also find lots of off-topic results about yachts that are named "Seal" or "Sea Lion" or yachts that have porthole seals that need maintenance, or hotels in Tahiti named "Seal" + something. But nothing useful.
You will find a spurious stock video of seals supposedly swimming in Moorea (an islan near Tahiti). It you look at that video closely, you'll see seaweed of a kind that clearly is NOT from Polynesia. (I suspect the video was just mistakenly tagged with that location at some point by a non-diving cataloger.)
I note that there's also a link to a book about The Quest and Occupation of Tahiti by Emissaries of Spain during the Years 1771 - 1776 . This text has a few seal sightings in Tahiti and nearby islands, but the text also makes it clear these were pretty rare. Probably a bit like the unfortunate little seal on Raivavae--it was present, but not really intentionally, and certainly not happily.
So, what WOULD be a better search strategy?
Given that "seal" is a pretty generic term, perhaps we could find a synonym that's much more specific. The easiest way I know to do that is to check out the Wikipedia article on seals (or sea lions, or walruses...) where we learn that they're all members of the order Pinnipedia.
Now, armed with that bit of information, we can do a search for:
[ pinnipeds Tahiti ]
Naturally, this tends to give us books and scholarly articles about pinnipeds/seals, but that's okay, I'd like some authority in my reading on this topic.
And while I found a few articles, the most interesting one was a book chapter in Pinnipeds and El Niño: Responses to Environmental Stress. The entire book is about pinnipeds in the Pacific, and although I read much of the book (and importantly, used "Find in this book" feature), I couldn't find ANY pinnipeds except on the far Eastern Pacific, and the lower latitudes, near New Zealand and Antarctica.
That's kind a stumper. Now what? Is there another way to frame this Challenge?
I remember from other reading about birds and animals that the term "distribution" and/or "range" are often used to describe the locations where animals live. SO... I tried these searches:
[ pinniped range ]
[ pinniped distribution ]
This worked pretty well! Checking Images.Google.com I found that the second query is much better (higher quality on-topic results) and quickly leads to this map.
 Figure 1 from the article MARINE MAMMAL SCIENCE, 28(2): 414–436 (April 2012)
As you can see, pinnipeds are primarily cold water residents, with high population densities around the poles. Interestingly, the west coasts of North and South America are notable for their cold currents that skim along the shore. There are a few other outlier seal populations in the Mediterranean and Caspian sea. Generally speaking, the tropics are a seal-free zone! (Note, however, that blue streak in the middle of the Northern Pacific--that's Hawai'i, and a bit of a special case.)
The article mentions that:
Generally speaking, with the single exception of monk seals in Hawai'i, seals and sea lions just don't live in tropical seas (unless there's a cold water current in the tropical latitudes).
Fascinating.
So while there are seals in Hawai'i (the now rare and endangered Monk seal, Neomonachus schauinslandi), they are the rather exceptional exception to the general rule that seals don't live in the tropics.
Aside from the occasional strays who wander into Tahitian waters, there just aren't seals in the area!
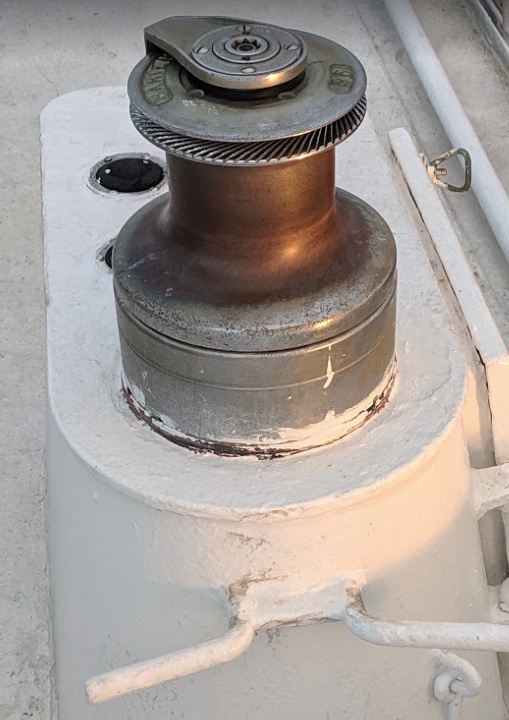
2. (Extra credit) On board our ship I found this device. I'm not a big ship sailor, so I don't know what it is. Can you figure out what this is, and what it's used for on board?

To start this search, I did a search-by-image, but that didn't work well, even after I tried using Bing's interactive cropping tool. I tried Google, I tried Bing, I tried Yandex... all to no avail. Nothing worked. It's just not a great Search-By-Image target image. (Too round, too generic...)
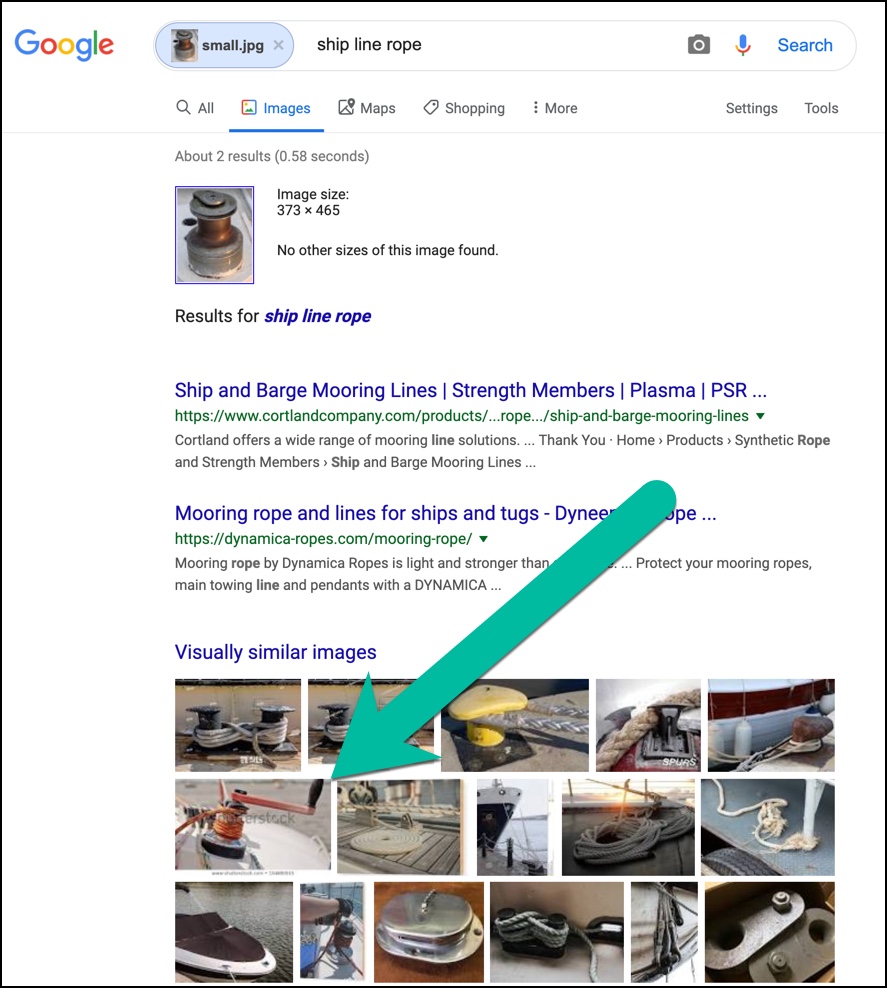
BUT.. remember that you can add search terms to the image AFTER you do the initial Search-By-Image. So, I modified the image search on Google by adding in the terms
[ ship line rope ]
To my delight, buried in the middle of this images I found something that looked a lot like what I was searching for...

And when I opened up the image, I learned it was a winch.
Then, by looking up what a winch was, learned there are two kinds of devices like this... it's either a winch, or a capstan--both of which look very similar. (The difference is that a winch is only used to tighten or loosen a line, while a capstan can lock the line in place. You use a winch to raise/lower sails, but you can use a capstan to tie your boat to a mooring point.)
=====
Postscript (Added after Regular Reader Arthur Weiss commented that he found it using Bing Image Search):
At Arthur Weiss wrote in the comments to the blog, you CAN find the winch by using Bing's impressive search-by-image tool. (I've written about this before: see "What's that logo?")
When I tried it, I didn't have any luck, but with Arthur's find, I re-tried the Bing search, and voila, there it was.
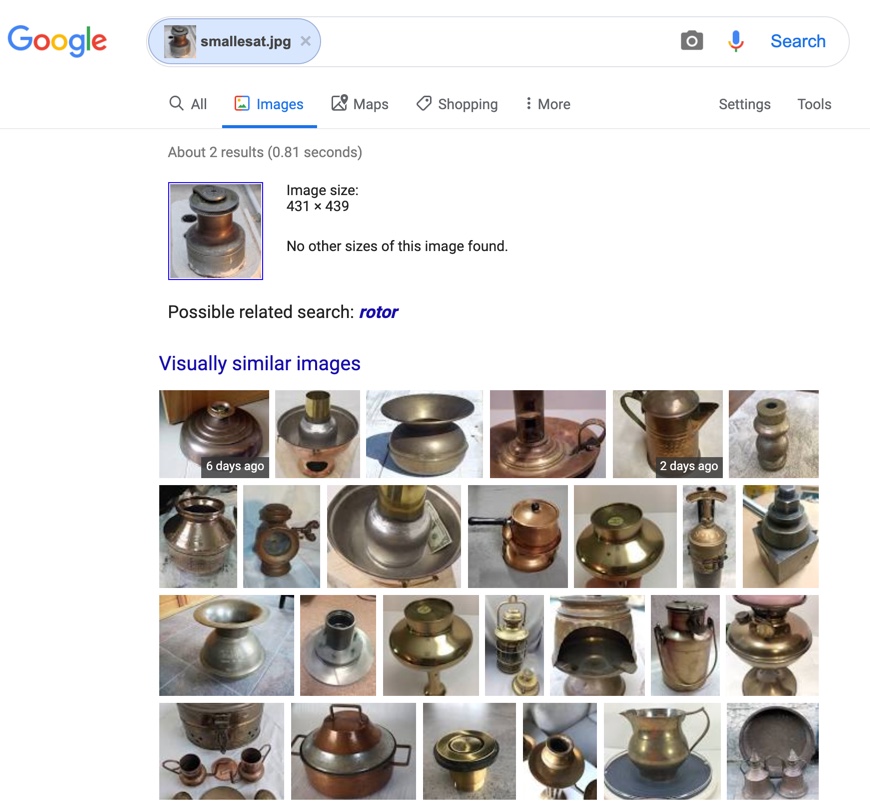
Here's what I did on Bing. You can see how much I cropped it down, "just to the relevant bits." Note the winch in the middle of the results on the right.

By contrast, if I do the same search using Google's Search-By-Image (using exactly the same cropped image), Google strikes out! Lesson learned: Try multiple search engines!
 Using the same cropped image, Google's Search-By-Image returns largely irrelevant things.
The suggestion ("rotor") is odd. Almost none of these things pictured are rotors.
Thanks, Arthur!
Search Lessons 1. If you're getting junk results, try reformulating with a less-common term. We used "pinniped" which means "seals and related creatures, and that shift to a technical term eliminated all kinds of off-topic results.
2. Knowing domain specific terminology. Once again, using the right search term--in this case, "distribution" and "range" to find specific kinds of results--was an important change to our search. Sometimes you just have to know the language of the topic. I picked up these specific terms from my earlier reading about birds and animals. Turns out these terms work for seals as well.
3. Modify a Search-By-Image by adding in additional terms that will provide context. This is an incredibly useful thing to remember when you're searching for an ambiguous target. In today's search, we added "ship" and "line" and "rope" and found what we were looking for. (I added "ship" to find only things associated with ships, then I added "line" because that's a common nautical term for a kind of rope, and then finally "rope" to find images that might not use the word "line.") That series of modifications (3 searches) made all the difference!
Hope you found this Challenge interesting and fun! I learned a few new things about pinnipeds while reading for this topic... and was once again reminded that there's a great value in knowing the specific terminology for an area. Part of this is just the habit of reading widely, increasing your personal vocabulary.
Note that having a rich vocabulary is more than just knowing the definition of a term, but also knowing what domain (that is, a topic area) it's used in. Everyone knows the word "distribution," but you might not have thought about it as a way to describe the concept where-an-animal-lives. Luckily, I've read enough of those bird identification books to have seen "distribution" used in that way.
Keep reading!
Search on!
my Californian mindset...
... but our Challenge from last week still remains. Remember, I asked:
While there, I saw lots of wildlife. Such as this anemonefish I found on Raiatea,
1. Is it true there are no seals or sea lions in Tahiti? If so why not? (Or did I just miss them?)
How would you do online research for a question like this? Remember that doing an obvious query like:
[ seals OR "sea lions" in Tahiti ]
is biasing the results towards ANYTHING that mentions seals or sea lions in Tahiti. (If you do this query, you'll find a sad story about a little seal who showed up in Raivavae in August, 2016. (Unfortunately, it was so far from home that it didn't survive.)
You'll also find lots of off-topic results about yachts that are named "Seal" or "Sea Lion" or yachts that have porthole seals that need maintenance, or hotels in Tahiti named "Seal" + something. But nothing useful.
You will find a spurious stock video of seals supposedly swimming in Moorea (an islan near Tahiti). It you look at that video closely, you'll see seaweed of a kind that clearly is NOT from Polynesia. (I suspect the video was just mistakenly tagged with that location at some point by a non-diving cataloger.)
I note that there's also a link to a book about The Quest and Occupation of Tahiti by Emissaries of Spain during the Years 1771 - 1776 . This text has a few seal sightings in Tahiti and nearby islands, but the text also makes it clear these were pretty rare. Probably a bit like the unfortunate little seal on Raivavae--it was present, but not really intentionally, and certainly not happily.
So, what WOULD be a better search strategy?
Given that "seal" is a pretty generic term, perhaps we could find a synonym that's much more specific. The easiest way I know to do that is to check out the Wikipedia article on seals (or sea lions, or walruses...) where we learn that they're all members of the order Pinnipedia.
Now, armed with that bit of information, we can do a search for:
[ pinnipeds Tahiti ]
Naturally, this tends to give us books and scholarly articles about pinnipeds/seals, but that's okay, I'd like some authority in my reading on this topic.
And while I found a few articles, the most interesting one was a book chapter in Pinnipeds and El Niño: Responses to Environmental Stress. The entire book is about pinnipeds in the Pacific, and although I read much of the book (and importantly, used "Find in this book" feature), I couldn't find ANY pinnipeds except on the far Eastern Pacific, and the lower latitudes, near New Zealand and Antarctica.
That's kind a stumper. Now what? Is there another way to frame this Challenge?
I remember from other reading about birds and animals that the term "distribution" and/or "range" are often used to describe the locations where animals live. SO... I tried these searches:
[ pinniped range ]
[ pinniped distribution ]
This worked pretty well! Checking Images.Google.com I found that the second query is much better (higher quality on-topic results) and quickly leads to this map.
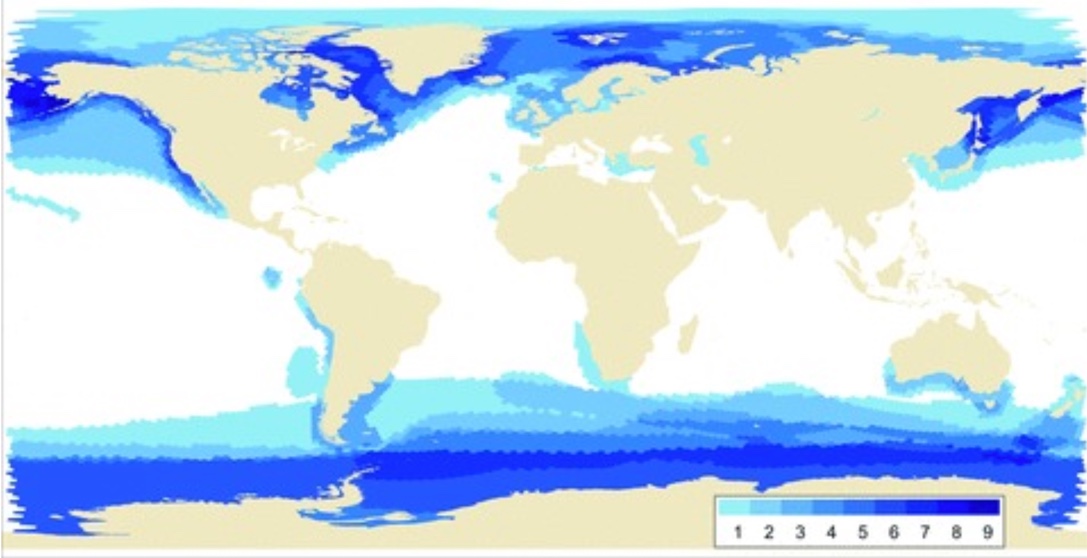 Figure 1 from the article MARINE MAMMAL SCIENCE, 28(2): 414–436 (April 2012)
As you can see, pinnipeds are primarily cold water residents, with high population densities around the poles. Interestingly, the west coasts of North and South America are notable for their cold currents that skim along the shore. There are a few other outlier seal populations in the Mediterranean and Caspian sea. Generally speaking, the tropics are a seal-free zone! (Note, however, that blue streak in the middle of the Northern Pacific--that's Hawai'i, and a bit of a special case.)
The article mentions that:
Pinnipeds do not conform to the generalization that marine mammals are concentrated in tropical and temperate regions (Schipper et al. 2008), although they do occurprincipally within continental shelf regions (Fig. 1). They are for the most part coldwater animals that occur in regions with high marine productivity. Upwelling areas(including those associated with sea-ice edges and coastal shelf inclines) and oceanfrontal areas are focal points for foraging for many pinniped species. Additionally,available data on species distributions of pinniped do not appear to conform to themarine mammal generality that suggests that range sizes are smaller toward the poles(Schipper et al. 2008). Many arctic and antarctic pinnipeds have large, circumpolarranges, while most tropical and midlatitude pinnipeds appear to have more restrictedranges...
Generally speaking, with the single exception of monk seals in Hawai'i, seals and sea lions just don't live in tropical seas (unless there's a cold water current in the tropical latitudes).
Fascinating.
So while there are seals in Hawai'i (the now rare and endangered Monk seal, Neomonachus schauinslandi), they are the rather exceptional exception to the general rule that seals don't live in the tropics.
Aside from the occasional strays who wander into Tahitian waters, there just aren't seals in the area!
2. (Extra credit) On board our ship I found this device. I'm not a big ship sailor, so I don't know what it is. Can you figure out what this is, and what it's used for on board?
To start this search, I did a search-by-image, but that didn't work well, even after I tried using Bing's interactive cropping tool. I tried Google, I tried Bing, I tried Yandex... all to no avail. Nothing worked. It's just not a great Search-By-Image target image. (Too round, too generic...)
BUT.. remember that you can add search terms to the image AFTER you do the initial Search-By-Image. So, I modified the image search on Google by adding in the terms
[ ship line rope ]
To my delight, buried in the middle of this images I found something that looked a lot like what I was searching for...
And when I opened up the image, I learned it was a winch.
Then, by looking up what a winch was, learned there are two kinds of devices like this... it's either a winch, or a capstan--both of which look very similar. (The difference is that a winch is only used to tighten or loosen a line, while a capstan can lock the line in place. You use a winch to raise/lower sails, but you can use a capstan to tie your boat to a mooring point.)
=====
Postscript (Added after Regular Reader Arthur Weiss commented that he found it using Bing Image Search):
At Arthur Weiss wrote in the comments to the blog, you CAN find the winch by using Bing's impressive search-by-image tool. (I've written about this before: see "What's that logo?")
When I tried it, I didn't have any luck, but with Arthur's find, I re-tried the Bing search, and voila, there it was.
Here's what I did on Bing. You can see how much I cropped it down, "just to the relevant bits." Note the winch in the middle of the results on the right.

By contrast, if I do the same search using Google's Search-By-Image (using exactly the same cropped image), Google strikes out! Lesson learned: Try multiple search engines!
 Using the same cropped image, Google's Search-By-Image returns largely irrelevant things.
The suggestion ("rotor") is odd. Almost none of these things pictured are rotors.
Thanks, Arthur!
Search Lessons 1. If you're getting junk results, try reformulating with a less-common term. We used "pinniped" which means "seals and related creatures, and that shift to a technical term eliminated all kinds of off-topic results.
2. Knowing domain specific terminology. Once again, using the right search term--in this case, "distribution" and "range" to find specific kinds of results--was an important change to our search. Sometimes you just have to know the language of the topic. I picked up these specific terms from my earlier reading about birds and animals. Turns out these terms work for seals as well.
3. Modify a Search-By-Image by adding in additional terms that will provide context. This is an incredibly useful thing to remember when you're searching for an ambiguous target. In today's search, we added "ship" and "line" and "rope" and found what we were looking for. (I added "ship" to find only things associated with ships, then I added "line" because that's a common nautical term for a kind of rope, and then finally "rope" to find images that might not use the word "line.") That series of modifications (3 searches) made all the difference!
Hope you found this Challenge interesting and fun! I learned a few new things about pinnipeds while reading for this topic... and was once again reminded that there's a great value in knowing the specific terminology for an area. Part of this is just the habit of reading widely, increasing your personal vocabulary.
Note that having a rich vocabulary is more than just knowing the definition of a term, but also knowing what domain (that is, a topic area) it's used in. Everyone knows the word "distribution," but you might not have thought about it as a way to describe the concept where-an-animal-lives. Luckily, I've read enough of those bird identification books to have seen "distribution" used in that way.
Keep reading!
Search on!
August 1, 2019
Rethinking Langmuir Circulation lanes
A couple of weeks ago...
... I asked what I thought was a simple question about "lanes" of quiet water that one can see on bodies of water. Here's that Challenge:
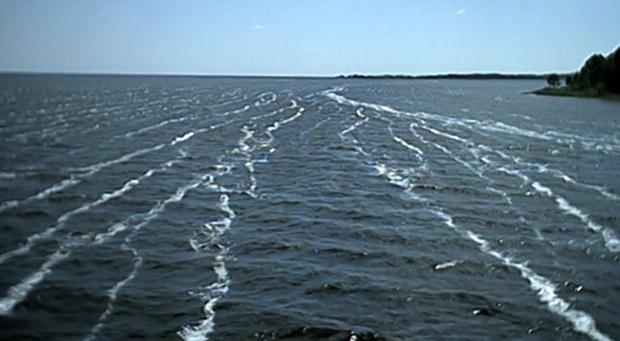
2. As we're sailing from place to place, it's not uncommon to see large patches of water without any ripples on the surface. It's something you see nearly everywhere--it's a common effect on lakes, ponds, and oceans. But what causes these ripple-free regions on the water? (See below for an image that has a large Y-shaped blank area in the middle. What causes this?)
I offered this image as an example of what I meant. See those blank spots?
And I found this other picture (see this Y-shaped quiet area in the left-center).
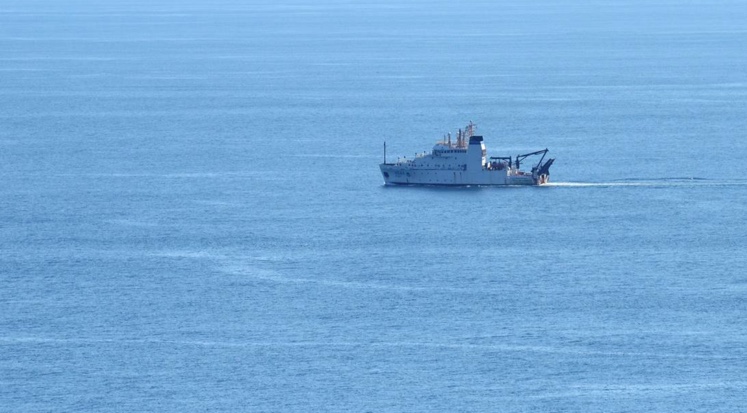
I tentatively identified them as lanes caused by Langmuir Circulation.
BUT THEN, as I was driving past the mouth of the Gualala River (in Northern California; it opens onto the Pacific) I saw THIS:
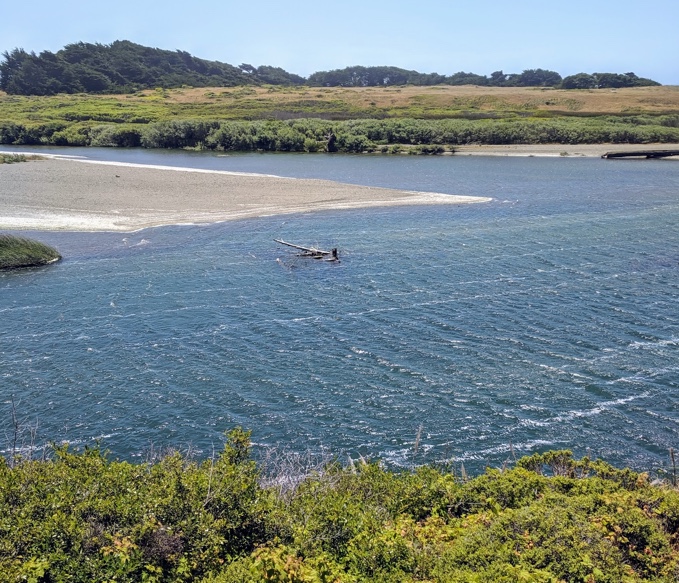
Here's a closeup below. Notice how the lines are VERY parallel, and run through the tree stump, and right onto the grassy shoreline at left. This is pretty clearly caused by Langmuir Circulation cells in the water. And yes, the wind was blowing (fairly hard) exactly along the lines. If you notice, there are lots of small waves on top of the cells. That's NOT quite what I was looking for: I wanted to find the cause of those glassy patches.
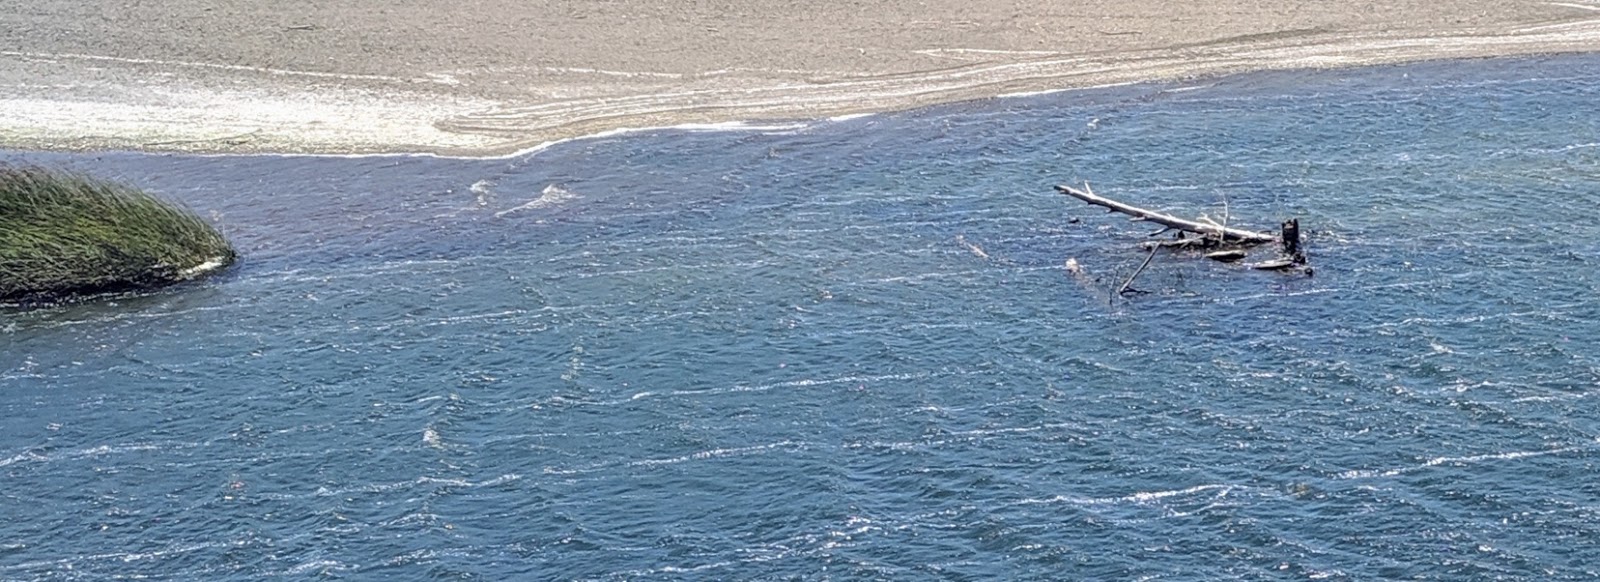 But as I stood there looking at them, they were NOT the same as the quiet / ripple-free regions I'd seen (as in the first two pictures above). These are clearly Langmuir cells, but there are LOTS of tiny wavelets on top of the water. Looks to me as though we're searching for another process than wind-induced long, linear cells. So... what's going on? I don't know. The search continues! Let me know if you run across anything that's relevant to the "quiet water" effect.
 Still searching!
July 31, 2019
SearchResearch Challenge (7/31/19): Are there seals in Tahiti?
I'm still in a Polynesian frame of mind...
... and so I've been thinking about what I saw in Tahiti and French Polynesia quite a bit over the past couple of weeks.
While there, I saw lots of wildlife. Such as this anemonefish I found on Raiatea,
and black-tipped reef sharks...
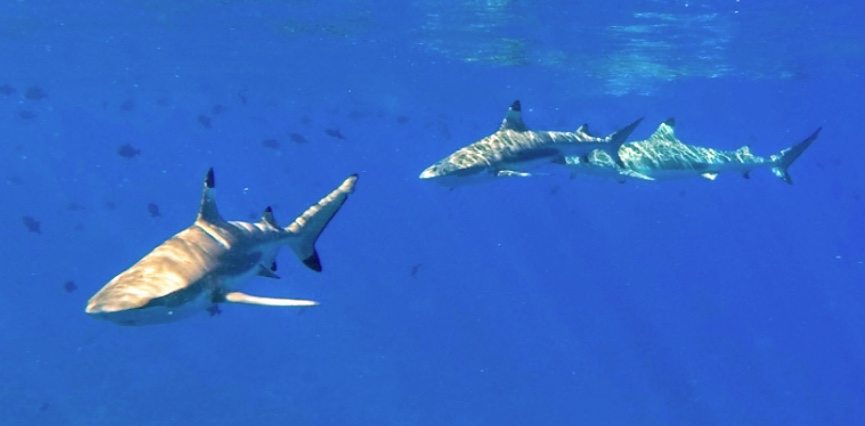
... and while there's a fair bit of large fauna (I can't resist showing you this group of eagle rays that flew past us one afternoon),
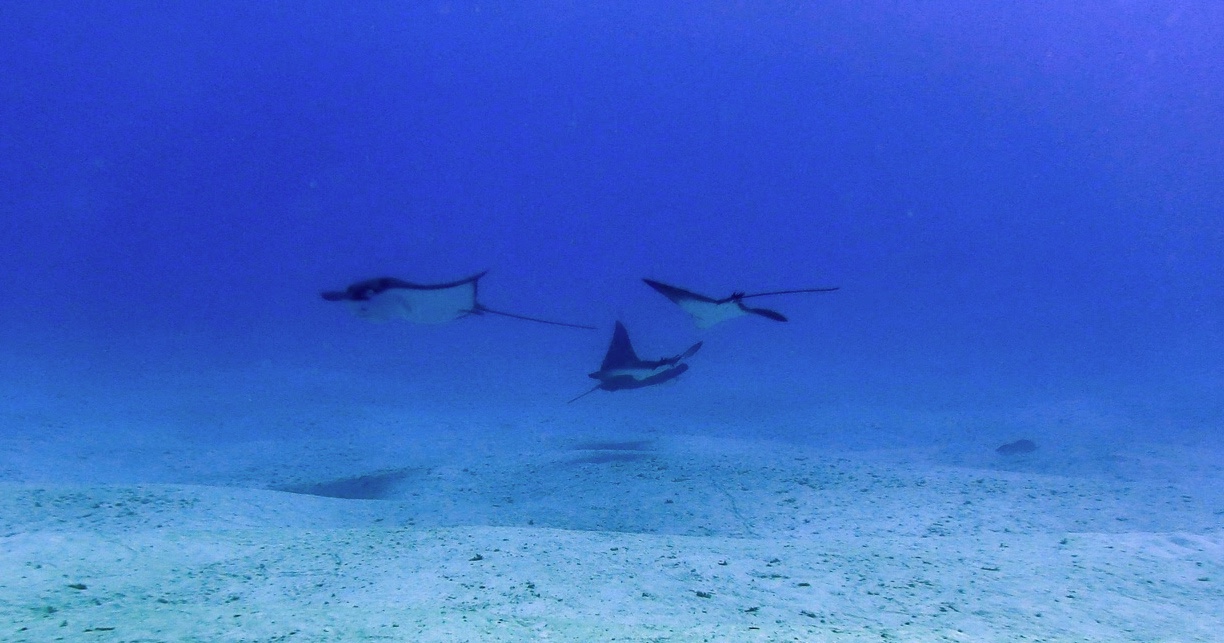
I noticed that there were few mammals in the sea. Sure, I saw a few dolphins, and the islands are famous for their humpback whales. But no otters (which I didn't really expect), and very oddly, no seals or sea lions! I've seen seals in Hawai'i, but why nothing south of the Equator?
This leads to today's Challenge:
1. Is it true there are no seals or sea lions in Tahiti? If so why not? (Or did I just miss them?)
I'm used to seeing seals / sea lions just about everywhere. This is what I see locally in Northern California,
 Harbor seals hauled out on a beach near Gulala, CA
So why are none of these (apparently) in Tahiti?
2. (Extra credit) On board our ship I found this device. I'm not a big ship sailor, so I don't know what it is. Can you figure out what this is, and what it's used for on board?
As always, the real Challenge not just to find the answer, but to let us know HOW you did it. What searches did you do? Did you actually just ask someone? (That's a legitimate way to do SearchResearch Challenges!) Or did you just happen to know? (That's okay too--just let us know.)
Just tell us HOW... in the comments below.
Search on!
July 25, 2019
Answer: A couple of questions about Polynesia! (Why so long? What are those clear patches?)
I'm back in Silicon Valley... but missing Polynesia..
If you get the chance to visit, you should. If the predicted sea level rise happens, many of these islands are going to be submerged. That's tragic, but what's worse is that the memory of these special places will vanish from the common culture.
But before solving the climate change problem, let's focus in on our Challenges.
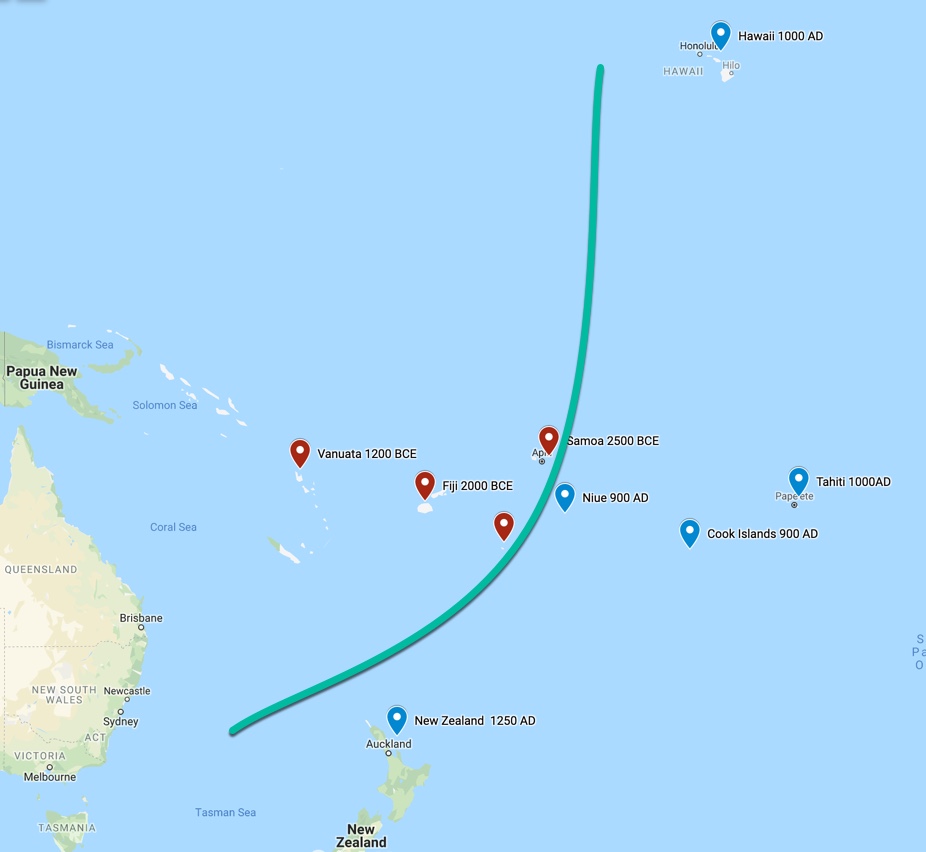
1. In researching the dates of initial colonization of Polynesian islands, I noticed a VERY strange incongruity. Look at the map below. The blue pins are all island nations that were first colonized around 1000AD. The red pins (to the left of the long green line) were all colonized around 1000BCE or before. What happened here between 1000BCE and 1000AD? Why are the all of the blue pins MUCH later than the red pinned locations? It's not that far from Samoa to Niue, why didn't anyone colonize that island until 900AD or so? Generally--why didn't the Polynesians go beyond the green line for a very long time?
This sounds simple enough... but it turns out to be a bit of a contentious issue. As I discovered, there's a bit of debate about the dates I show above. Getting a definitive answer to this is probably a PhD's thesis worth of work (and there are people doing exactly that!), but let's see what we can do with our SRS skills. I started my research with this query: [ Polynesia colonization dates ] which gave me this SERP:
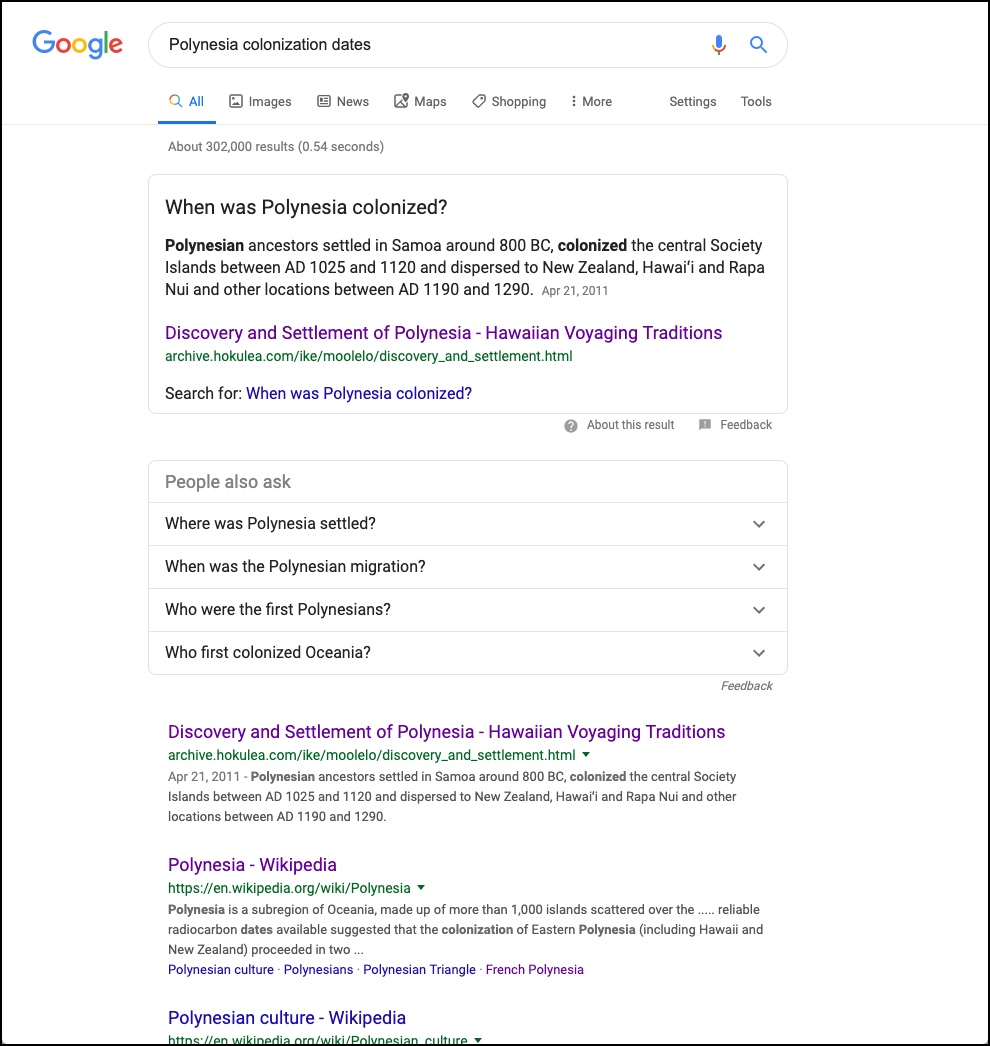
As you can tell, I opened up several tabs in parallel to get a quick sense of the breadth of opinion on this:
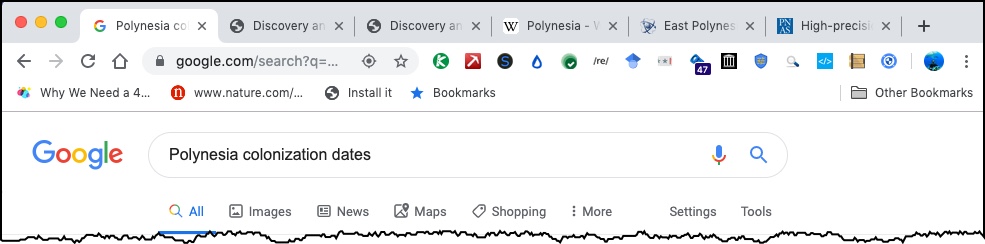
The first tab is from Hokulea.com (a Hawaiian cultural education site), the second is from Wikipedia, 3rd is from Phys.org (a science news site). Others I opened were from other science journalism sites. By reading about 10 such sites, I quickly learned that there's some disagreement about the exact dates for Polynesian island colonization. The root of the discussion is about the accuracy of the methods used in previous research. (There's a big discussion about the accuracy of the reported 14C measurements.) But after reading through many of these reports, the overall pattern still holds. The dates might be off by anywhere from 75 - 150 years, but the overall story remains the same. The precusors of the Polynesians moved from somewhere in southeast Asia to colonize the islands around Melanesia, stopping sometime around 1000BCE. (This model of expansion is supported by genetic, linguistic, and archaeological data. See: Wikipedia article on Polynesia; Proc. National Academy article about Polynesia colonization; Stanford summary of dates)Here's a visual map of this (modified from the PNAS article):
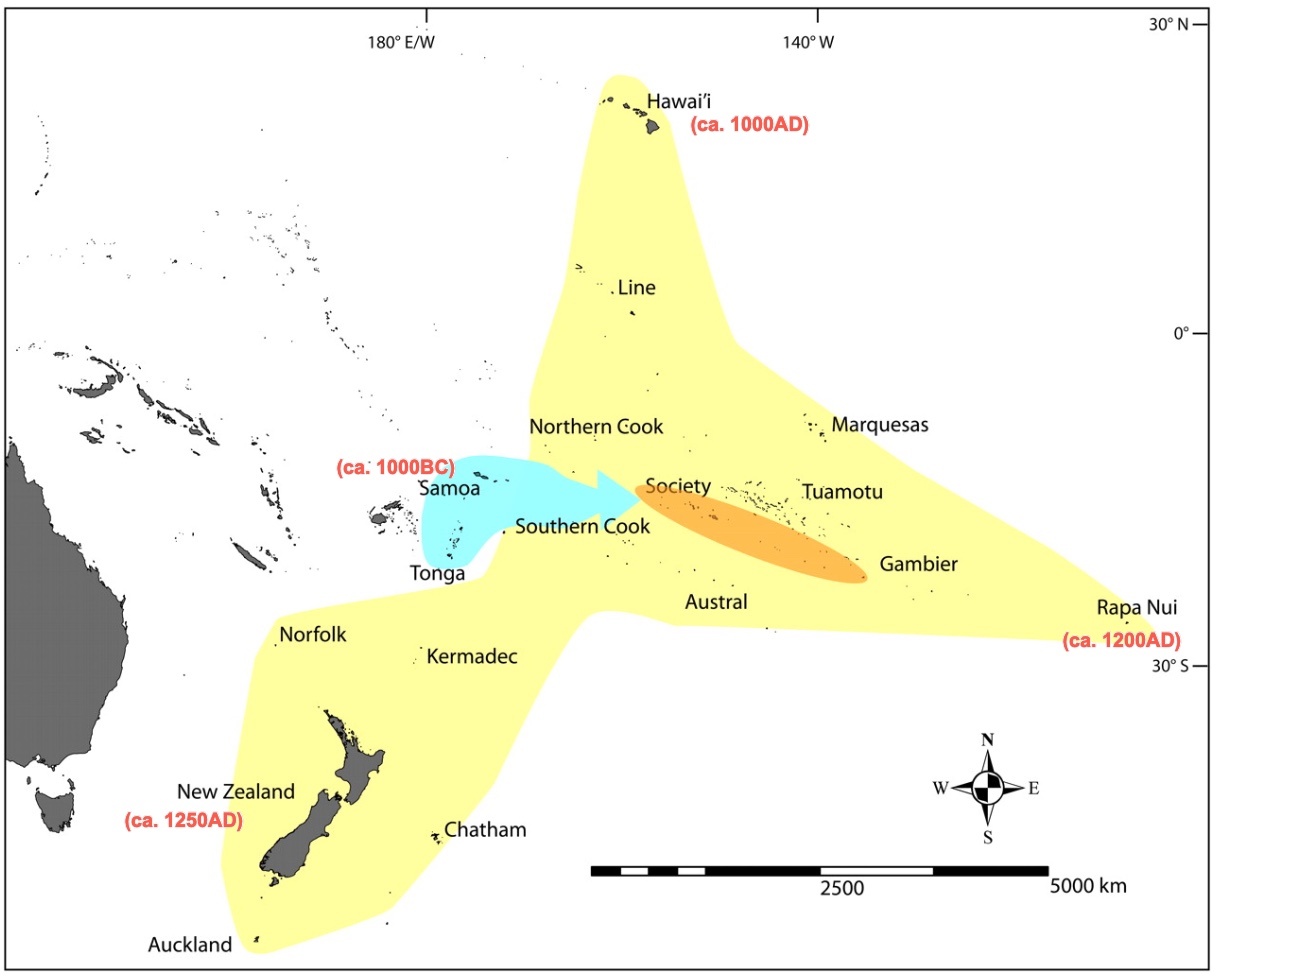 Expansion migration out of West Polynesia (blue area), There was a first expansion to the Society Islands between A.D. ∼1025 and 1121 (orange), and a second expansion to the farther islands between A.D. ∼1200 and 1290 (yellow area).While this is confirmation (and consistent with what I'd found already), as I was reading, I kept finding the phrases "Polynesian pause" and "Polynesian expansion." Both seemed to describe what I was looking for. As we know, finding a common phrase that describes what you're searching for is an incredibly valuable thing. Armed with this, I did two searches. One on Scholar and one on Books, both with the same search query. NOTE that this isn't a search for a synonym (such as "Polynesian OR Tahitian"), but a search for two very different phrases. I'd be happy with either phrase being in the document.
 [ "polynesian pause" OR "polynesian expansion" ]
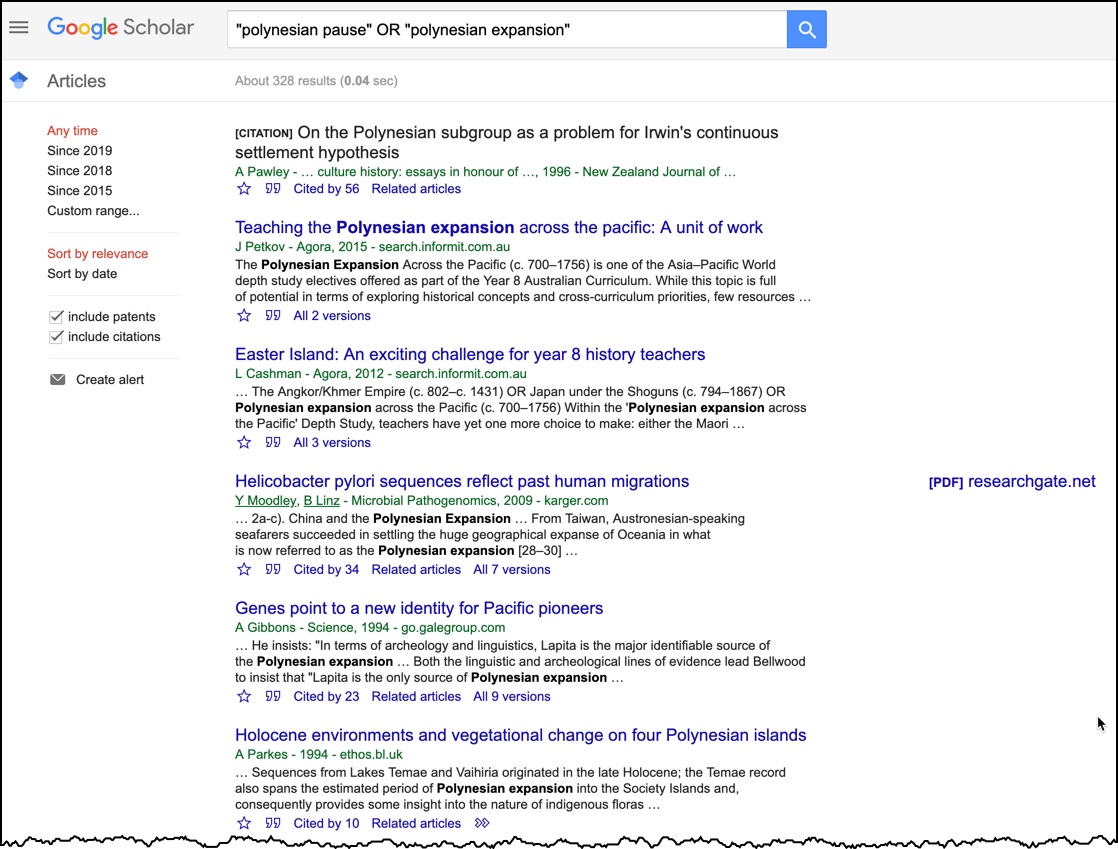 A search on Google Scholar has pretty good results for this search combined search.
 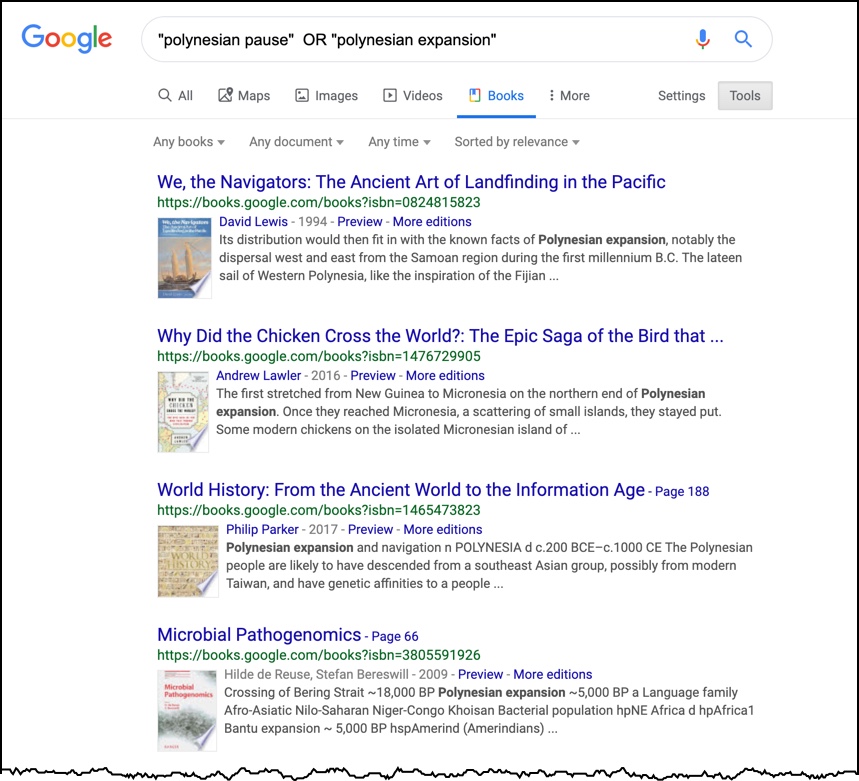 Likewise...
 After reading through a bunch of these hits--both books and scholarly articles--I had a newfound appreciation for the difficulty of tracking the movement of people across thousands of years and thousands of miles. (The biggest surprise was the relevance of the book "Microbial Pathogenomics," which turns out to suggest a way of tracking expansion by tracking the movement of a distinctive gut bacteria, hpEastAsia, across the islands of Polynesia by looking at the bacterial populations of their current residents!)But the original Challenge was "WHY was there a thousand-year-long pause in the migration?" What did I find? Lots of speculation--wild guesses and hypotheses. Nobody, it seems, knows WHY this happened. But one paper on this topic stands out as the current dominant hypothesis. "From west to east: Environmental influences on the rate and pathways of Polynesian colonization" (by Alvaro Montenegro, Richard T. Callaghan, and Scott M. Fitzpatrick; The Holocene 24.2 (2014): 242-256) uses a combination of weather models (including common Pacific winds and currents) and departures from different points in central Polynesia show that ...
".. the eastern boundary of West Polynesia, the limit of the initial colonization pulse, is marked by a discontinuity in land distribution, where the distances travelers would have to cross in order to reach islands further to the east become significantly larger. At the same time, in West Polynesia, the frequency and intensity of winds favorable to eastward displacement decrease continuously from west to east.... Voyaging simulations show that intentional eastward voyages departing from Tonga and Samoa, when undertaken with vessels capable of sailing efficiently against the wind, afford a viable route toward several island groups in East Polynesia, with trips starting in Samoa having a higher probability of success."
Hidden in that complex language are a couple of ideas. (1) The winds and currents at the West/Central boundary form a kind of natural barrier to eastward expansion. (2) It's hard to cross that barrier until you have watercraft that can sail into the wind. Did it take a millennium to develop ships that can sail into the wind? Maybe. And maybe it took that long to both develop the ship technology AND grow a set of people who were willing to make those blind voyages into the unknown in search of other lands. It's possible that the upwind sailing tech was developed not long after arriving at the eastern edge, but that there wasn't a tradition of making those voyages. At this point in history, it's hard to know. As I can do is point to sources that make these speculative suggestions.
2. As we're sailing from place to place, it's not uncommon to see large patches of water without any ripples on the surface. It's something you see nearly everywhere--it's a common effect on lakes, ponds, and oceans. But what causes these ripple-free regions on the water? (See below for an image that has a large Y-shaped blank area in the middle. What causes this?)
To answer this Challenge, I tried a lot of variations on what I thought would be a reasonable query: [ lines of flat water ] [ areas of calm water on ocean ] [ regions no waves ]
And so forth. I found that some search terms (e.g., "wavelets") added an entirely new (and off-topic for me) dimension, so I learned to avoid those terms. After a few tried like this (mostly with unhelpful results), I switched to Image search, hoping to recognize an image that looked like what I wanted and learn from that page what this might be called. When I did this search: [ lines of calm water on ocean ] I finally found a picture that looked like what I'd been searching for...
This article called them Langmuir Circulation lines. Searching a bit for that taught me that they're "a series of shallow, slow, counter-rotating vortices at the ocean's surface aligned with the wind. [These form] .. when wind blows steadily over the sea surface." Where the long, wind-caused vortex hits the surface, that has a calming effect on the texture of the water. And that's possible... but I hadn't thought to measure which way the wind was blowing when I took the photo! (I will next time.) As I looked more, I found that Langmuir circulation often also produces long "wind rows" of form on the edges of the circulation cells. (See below.)
Is this the same phenomenon? Quite possibly. The diagnostic test would be to see if the wind is blowing in the same direction as the lines of foam.. or the quiet area seen in the other images. As SRS reader Unknown pointed out, there are probably multiple reasons for these quiet lanes in the sea. But for the moment, I'll go with Langmuir Circulation lanes... and remember to test this hypothesis by noting the wind direction!
Search Lessons 1. Take note of special terminology that precisely describes your topic. As I noted when reading through all of the Polynesian articles, those two phrases "Polynesian Expansion" and "Polynesian Pause" seemed to pop up often. By searching specifically for those two phrases (in Google Books and Google Scholar), I was able to find a bunch of high quality resources. Take note of repeated phrases like this--they can be the key! 2. Realize that some simple-to-ask questions might not have simple, short answers--ESPECIALLY "why" questions. Getting a definitive answer to "why did the Polynesian pause suddenly stop?" is tough. It's easy to find ideas, but getting to a high quality proof behind the why is probably not possible. (Or at least it's really not simple!) 3. Switching to a different medium can help. In the "lines of calm water" Challenge, it was faster to look at the image search results rather than read all of the text that might be difficult to understand. Visual confirmation can often get you to the right resources faster than anything else. Don't forget about the value of the visual! 4. Use parallel browsing and browsing-in-depth to organize your searching. It's a handy technique to know... and can simplify your searching!
Thanks for reading (and playing) along. This wasn't simple. Next week I have two more questions from my recent travels. I'll post those a week from today (next Thursday) instead of Wednesday. Don't panic! All is well (but busy) in SearchResearch Land!
Search on!
July 17, 2019
Answer coming next week!
While travel in French Polynesia is great...
... the wifi is rather slow and unpredictable. As a side-effect, I haven't been able to get a good connection for a long enough period of time to actually do the online research needed to get answers to last week's Challenge.
 A drone's eye view of the harbor at Huahine. Note the fringing reef and coral sands all around.
 These waters have many parrotfish!
SO... I'm going back to diving in these beautiful waters and hiking on the mountains. I should be back in the land of fast connectivity by Saturday. So I'll post my answers in one week.
Until then,
Search on!
July 11, 2019
SearchResearch Challenge (7/7/2019): A couple of questions about Polynesia! (Why so long? What are those clear patches?)
I managed to find wifi!
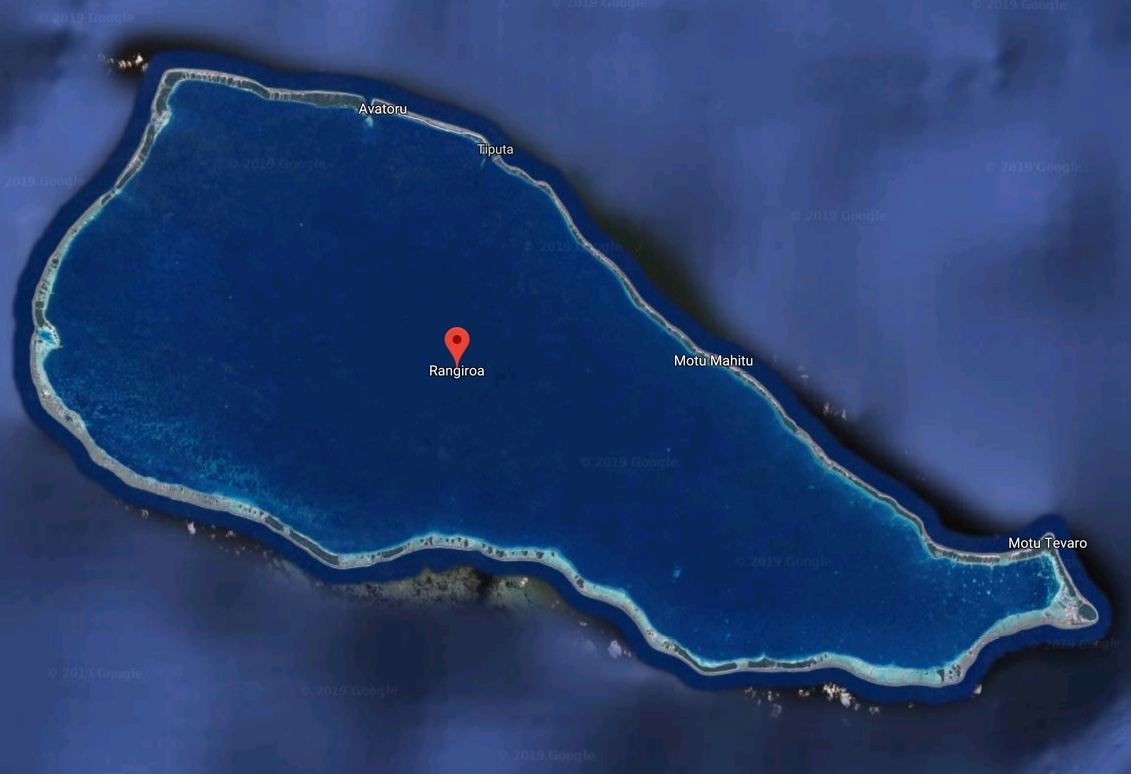
As I mentioned last week, I'm touring through French Polynesia for the next two weeks. It's kind of a long way to go, but it's completely worth it. Lots of long stretches as we sail from one island to the next. Many of these are coral atolls, and look a bit like this as we sail by. They're all low-slung, just barely out of the water. You wonder how they survive when a big storm comes through.
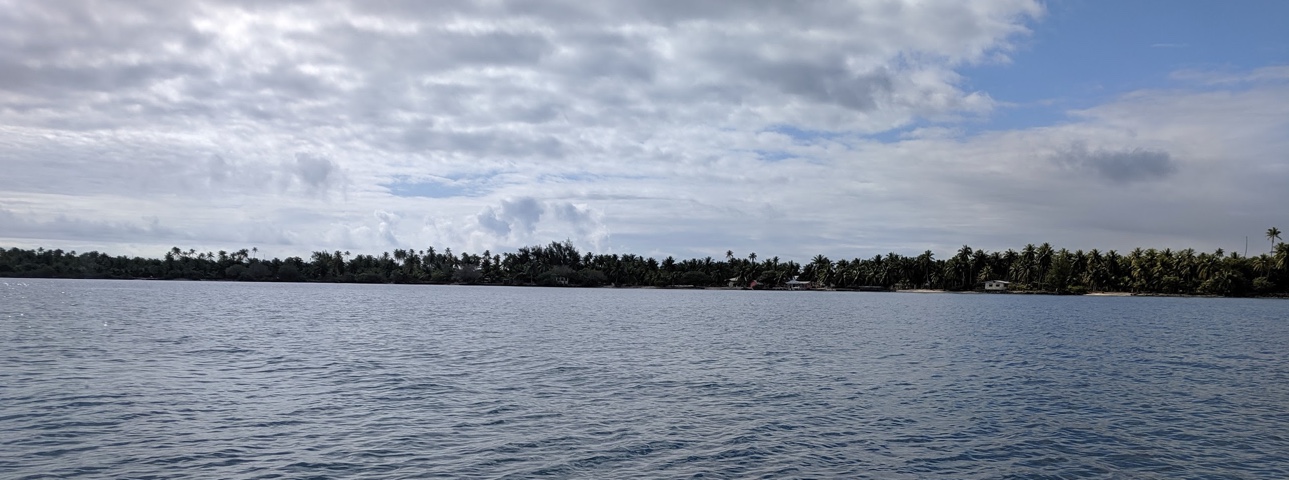 Rangiroa seen from the sea.
Or like this, from a satellite image:
As I've said before, traveling is an endless source of SRS questions. Here, in this place, there are SO many things I've had to look up--my SRS skills are getting a great workout! What kind of tree is that? Does the nut from that tree really have fish-stupefying properties? Really?
Many of the things I've been seeing need a bit of research to help me understand what I'm seeing.
This week I've got two Challenges, but on the next cycle, I'll add two more. But for today, let's start with one slightly difficult Challenge, and a simpler one.
1. In researching the dates of initial colonization of Polynesian islands, I noticed a VERY strange incongruity. Look at the map below. The blue pins are all island nations that were first colonized around 1000AD. The red pins (to the left of the long green line) were all colonized around 1000BCE or before. What happened here between 1000BCE and 1000AD? Why are the all of the blue pins MUCH later than the red pinned locations? It's not that far from Samoa to Niue, why didn't anyone colonize that island until 900AD or so? Generally--why didn't the Polynesians go beyond the green line for a very long time?
2. As we're sailing from place to place, it's not uncommon to see large patches of water without any ripples on the surface. It's something you see nearly everywhere--it's a common effect on lakes, ponds, and oceans. But what causes these ripple-free regions on the water? (See below for an image that has a large Y-shaped blank area in the middle. What causes this?)
As always, be sure to tell us not JUST the answer, but how you figured it out! What searches worked for you, and if you spend a lot of time on a rathole that doesn't work out, be sure to leave us a comment to that effect. We can learn a lot from strategies that don't work out.
Search on!
July 6, 2019
Answer (Part 2): What DO we know about history, math, and geography?
Last time we talked about history...
Now, let's talk about math and geography and how much people know about each.
 In this excerpt from Raphael's fresco The School of Athens, Pythagoras is shown writing in a book as a young man presents him with a tablet. It shows a diagrammatic representation of a lyre above a drawing of the sacred tetractys. Do you know Pythagoras and his contributions to mathematics? Do you know why the lyre is significant here?
Let's try repeating what we did last time for history.
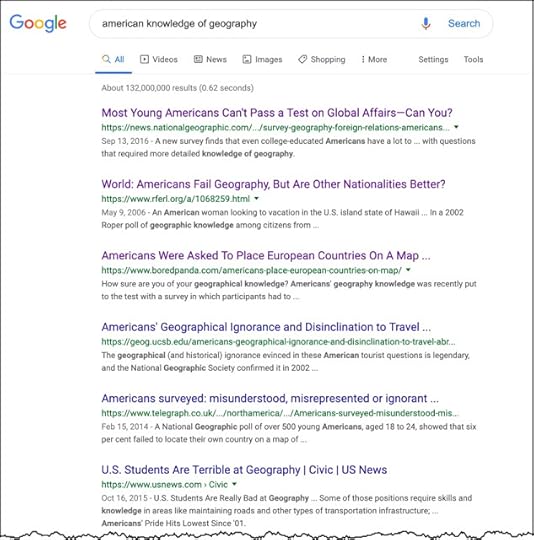
[ American knowledge of math ]
And we see a similar result:

Here you go: Lots of results telling us that Americans are terrible at math. Once again I'll open up the top 10 results in parallel browsing and take a look.
Even the New York Times has an article with the headline, "Why do Americans Stink at Math?" from 2014. Although it's a compellingly dismal story about American's ability to do math and why the education system isn't working. But it refers to the results of studies (but does not give any citation) for their data.
We must dig deeper, looking at the articles AND who publishes each, AND where they get their data from.
1. US News and World Report "Why students are bad at math" -- points us to the 2017 National Assessment of Education Progress. We've seen this data source before in our previous post. This org is also called NAEP and this report is called "The Nation's Report Card," and summarizes the results of testing across a wide spectrum of US schools for grades 4, 8 and 12. (I'm alway encouraged by a data source when you can download the data for yourself. Open data is a sign of a reputable organization, one that's willing to let you look at the raw data source.) Here's their 2017 Math data set in PDF form. Here's the top line of that report. (If you're interested, it's worth looking through the data for all of the metadata about their testing methods, and all of the data exceptions--which all data sets have, but which give me confidence that they took good care collecting this data.)
 Click to see this figure at full-size.
Summary of this data? There's been a huge drop in math test scores between 1991 and 2017 almost across the board for grades 4 and 8.
2. The Quartz.com article "Americans are spectacularly bad at answering even the most basic math questions." is another dismal headline. This article points to the PISA studies done by the OECD (Organisation for Economic Co-operation and Development). As they say on their website, "PISA is the OECD's Programme for International Student Assessment. Every three years it tests 15-year-old students from all over the world in reading, mathematics and science. The tests are designed to gauge how well the students master key subjects in order to be prepared for real-life situations in the adult world."
This is an interesting comparison source that I hadn't thought about: How can we measure one country's math understanding? By comparing test scores with other countries!
What this this test show?
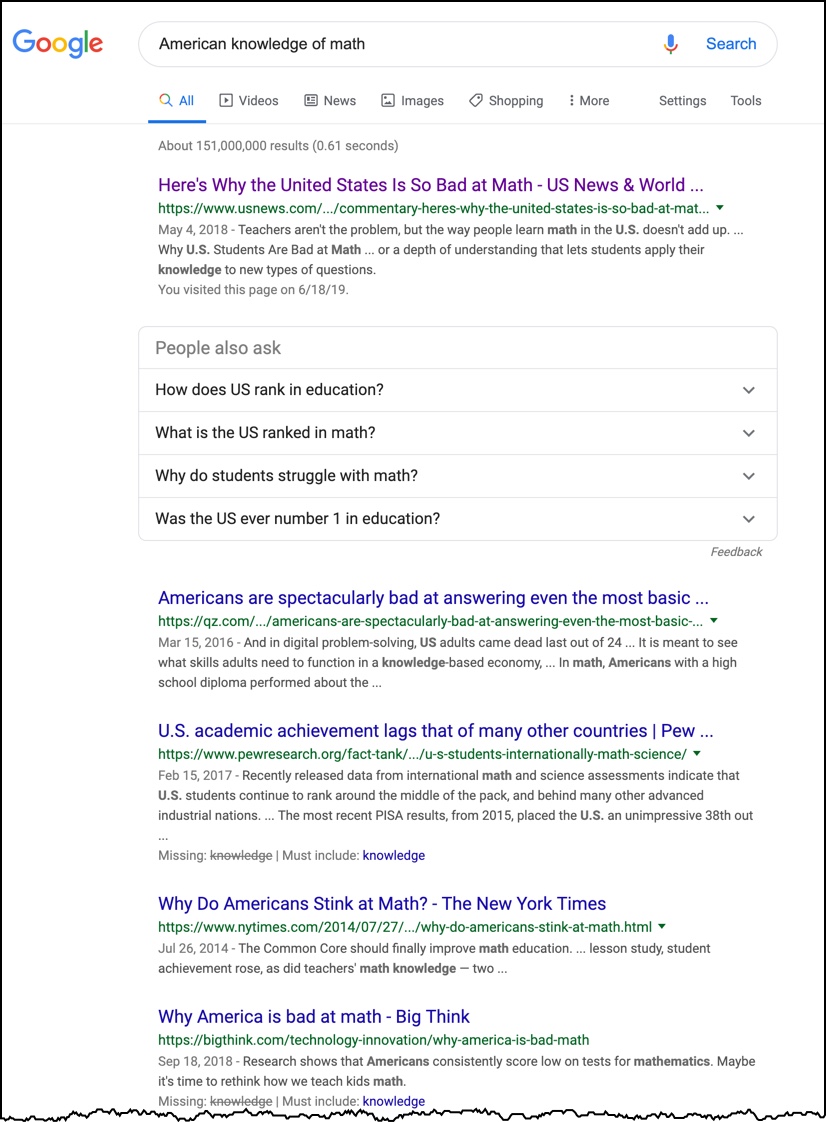
Uh oh, this means the US isn't even in the top 10. Where are we? You can look at their test data overview here. And this is the key chart...
 Click to see full size.
As the overview reports:
3. The Pew Research Center's report, "U.S. Students' academic achievement still lags that of their peers in many other countries" also points to the OECD / PISA study AND several others, giving a nicely integrated overview of the data. They put a slightly more optimistic spin on the data. They tell us that American students' math skills have increased over the past according to the NEAP scores from 1990 - 2015, although there seems to be a small tailing off in 2015...
 Chart from the Pew study. Credit: Pew Research Center.
They also looked at the PISA data (from above) and show the results slightly differently:
 The US position in world math test scores. Data from PSA, chart by Pew Reearch.
I could go on here, but you get the point. Of the top 10 results on the SERP, 10 had bad news about the state of math education in the US. Many of the results are from reputable sources, they expose their testing methods, and they share their data sets. The evidence is pretty overwhelming--the US is not doing a great job teaching mathematics to their students. There's much to do here in teaching our students how to do math.
Our other SearchResearch Challenge was about geographic knowledge.
How is the US doing there?
Let's use our same approach as before:
And by doing the same analysis (who wrote the article? what's their bias? why did they write this article?)
The first article is from National Geographic, a well-known (and highly reputable) source of geographic information. They cite a survey done for them by the Council on Foreign Relations about "What College-Aged Students Know About the World: A Survey on Global Literacy." The upshot?
This doesn't really surprise me. I live in a United States that is profoundly inward-looking. Just out of curiosity I asked [ how many US citizens have a passport ] and found that about 37% of the population has one, compared to Canada’s 60% and the United Kingdom’s 75%. This means that nearly 2 out of 3 Americans can’t even fly to Canada, let alone travel to anywhere else in the world (according to a report from the geography department at UC Santa Barbara).
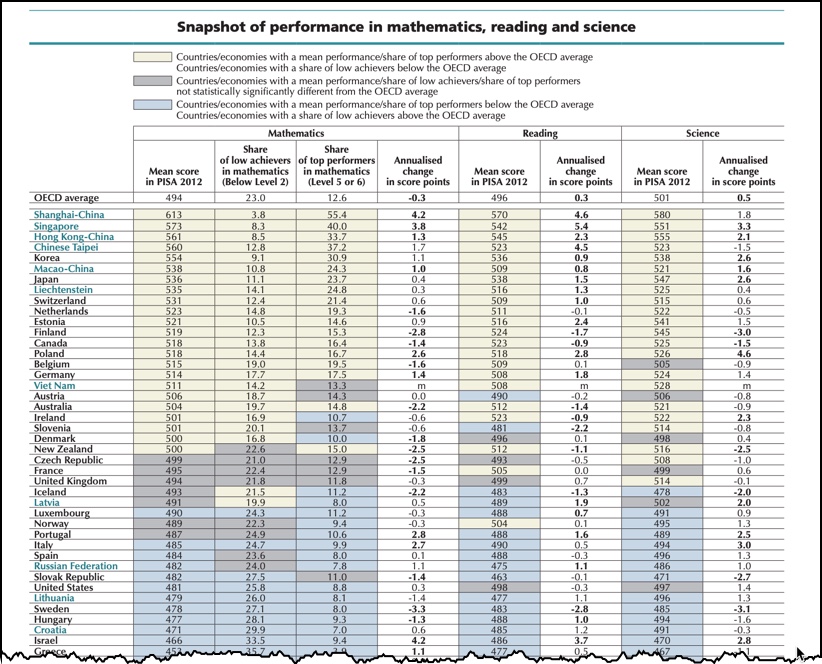
But it's distressing. While doing the research for this article I ran across a 2017 New York Times story, If Americans Can Find North Korea on a Map, They’re More Likely to Prefer Diplomacy, which includes this sobering image. With North Korea in the news on a daily basis, wouldn't you expect a more accurate hit rate?
 Data collected by the New York Times. From "If Americans Can Find North Korea on a Map..."
Out of 1.746 US adults who were asked to click on the location of North Korea (on an unlabelled map), only 36% got it right. The light blue dots are all of the incorrect locations. This is crazy.
This has a real-world consequence. As the author, Kevin Quealy writes:
The only factor (e.g. gender, age, education, etc.) that seemed to make much of a difference in locating Korea on a map was "Do you know someone of Korean ancestry?"
Once again, we have much to do to help our students (and ourselves) understand the world at large. We live in an international web of countries and businesses--it's useful to at least know where they are!
Search Lessons
There's an obvious point here about the remarkable lack of knowledge in mathematics and geography, but that's not the goal of SearchResearch (although I personally feel this is a terrible state of affairs).
The SRS Lessons are:
1. To find reliable data, look for data sets. If an author isn't showing you the data, be skeptical. Reliable places tend to link to their open data. If that's not happening, be skeptical.
2. Our query pattern [ American knowledge of X ] seems to work pretty well. I'd be curious to hear from SRS readers if this works well in other countries. What did YOU find worked?
3. Parallel browsing (by opening tabs from the SERP within the window), and then going deep on a topic in a new window, is a remarkably efficient way to do quick broad-brush research.
Note: I'm about to set out on two weeks of travel in a place that might (or might not) have an internet connection. I'll try to post next week, but if I don't post, don't worry--I'm just having too much fun diving in some exotic corner of the world!
Search on!
Now, let's talk about math and geography and how much people know about each.
 In this excerpt from Raphael's fresco The School of Athens, Pythagoras is shown writing in a book as a young man presents him with a tablet. It shows a diagrammatic representation of a lyre above a drawing of the sacred tetractys. Do you know Pythagoras and his contributions to mathematics? Do you know why the lyre is significant here?
 1. Can you find a high-quality (that is, very credible) study of how well the citizens of the United States (or your country, if you're from somewhere else) understand (A) history, (B) geography, (C) mathematics?
Let's try repeating what we did last time for history.
[ American knowledge of math ]
And we see a similar result:
Here you go: Lots of results telling us that Americans are terrible at math. Once again I'll open up the top 10 results in parallel browsing and take a look.
Even the New York Times has an article with the headline, "Why do Americans Stink at Math?" from 2014. Although it's a compellingly dismal story about American's ability to do math and why the education system isn't working. But it refers to the results of studies (but does not give any citation) for their data.
We must dig deeper, looking at the articles AND who publishes each, AND where they get their data from.
1. US News and World Report "Why students are bad at math" -- points us to the 2017 National Assessment of Education Progress. We've seen this data source before in our previous post. This org is also called NAEP and this report is called "The Nation's Report Card," and summarizes the results of testing across a wide spectrum of US schools for grades 4, 8 and 12. (I'm alway encouraged by a data source when you can download the data for yourself. Open data is a sign of a reputable organization, one that's willing to let you look at the raw data source.) Here's their 2017 Math data set in PDF form. Here's the top line of that report. (If you're interested, it's worth looking through the data for all of the metadata about their testing methods, and all of the data exceptions--which all data sets have, but which give me confidence that they took good care collecting this data.)
 Click to see this figure at full-size.
 Summary of this data? There's been a huge drop in math test scores between 1991 and 2017 almost across the board for grades 4 and 8.
2. The Quartz.com article "Americans are spectacularly bad at answering even the most basic math questions." is another dismal headline. This article points to the PISA studies done by the OECD (Organisation for Economic Co-operation and Development). As they say on their website, "PISA is the OECD's Programme for International Student Assessment. Every three years it tests 15-year-old students from all over the world in reading, mathematics and science. The tests are designed to gauge how well the students master key subjects in order to be prepared for real-life situations in the adult world."
This is an interesting comparison source that I hadn't thought about: How can we measure one country's math understanding? By comparing test scores with other countries!
What this this test show?
"Shanghai-China has the highest scores in mathematics, with a mean score of 613 points – 119 points, or the equivalent of nearly three years of schooling, above the OECD average. Singapore, Hong Kong-China, Chinese Taipei, Korea, Macao-China, Japan, Liechtenstein, Switzerland and the Netherlands, in descending order of their scores, round out the top ten performers in mathematics..."
Uh oh, this means the US isn't even in the top 10. Where are we? You can look at their test data overview here. And this is the key chart...
 Click to see full size.
 As the overview reports:
Among the 34 OECD countries, the United States performed below average in mathematics in 2012 and is ranked 27th (this is the best estimate, although the rank could be between 23 and 29 due to sampling and measurement error). Performance in reading and science are both close to the OECD average. The United States ranks 17 in reading, (range of ranks: 14 to 20) and 20 in science (range of ranks: 17 to 25). There has been no significant change in these performances over time.
Meanwhile, mathematics scores for the top-performer, Shanghai-China, indicate a performance that is the equivalent of over two years of formal schooling ahead of those observed in Massachusetts, itself a strong-performing U.S. state.
Just over one in four U.S. students do not reach the PISA baseline Level 2 of mathematics proficiency – a higher-than-OECD average proportion and one that hasn’t changed since 2003. At the opposite end of the proficiency scale, the U.S. has a below-average share of top performers....
3. The Pew Research Center's report, "U.S. Students' academic achievement still lags that of their peers in many other countries" also points to the OECD / PISA study AND several others, giving a nicely integrated overview of the data. They put a slightly more optimistic spin on the data. They tell us that American students' math skills have increased over the past according to the NEAP scores from 1990 - 2015, although there seems to be a small tailing off in 2015...
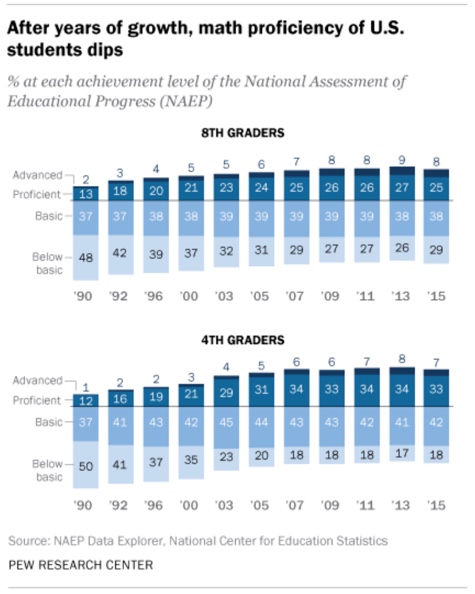 Chart from the Pew study. Credit: Pew Research Center.
 They also looked at the PISA data (from above) and show the results slightly differently:
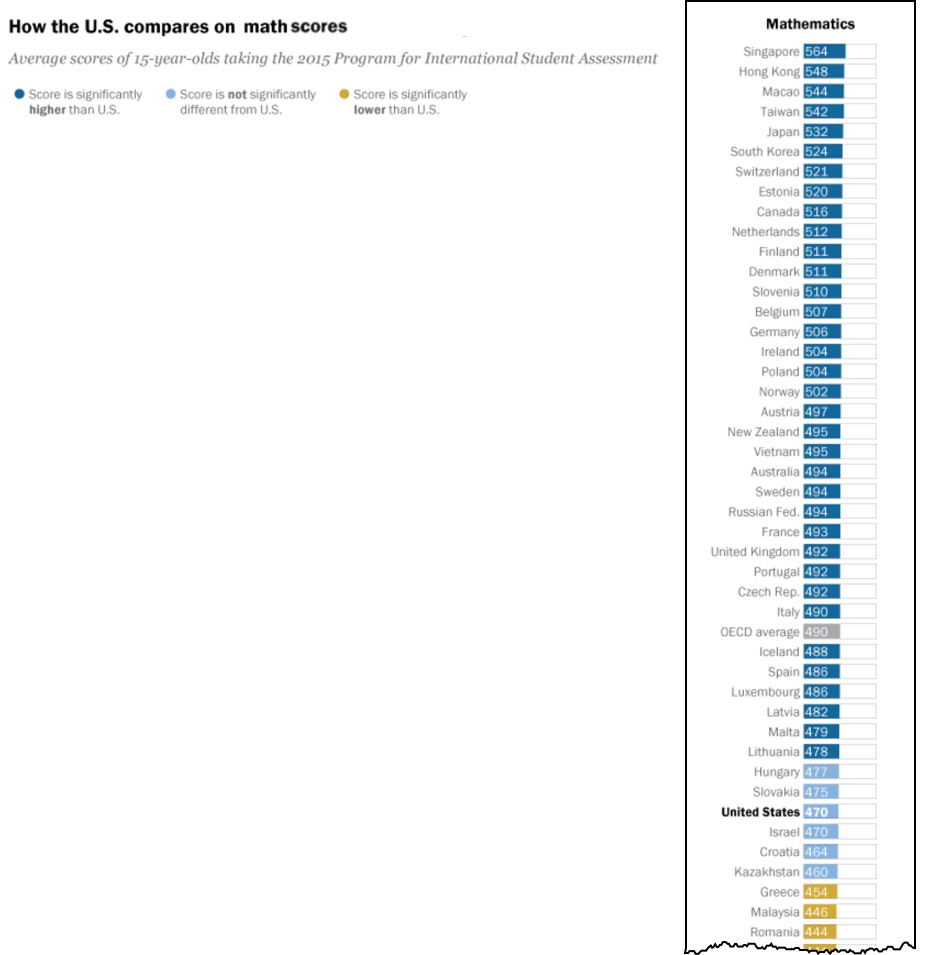 The US position in world math test scores. Data from PSA, chart by Pew Reearch.
 I could go on here, but you get the point. Of the top 10 results on the SERP, 10 had bad news about the state of math education in the US. Many of the results are from reputable sources, they expose their testing methods, and they share their data sets. The evidence is pretty overwhelming--the US is not doing a great job teaching mathematics to their students. There's much to do here in teaching our students how to do math.
Our other SearchResearch Challenge was about geographic knowledge.
How is the US doing there?
Let's use our same approach as before:
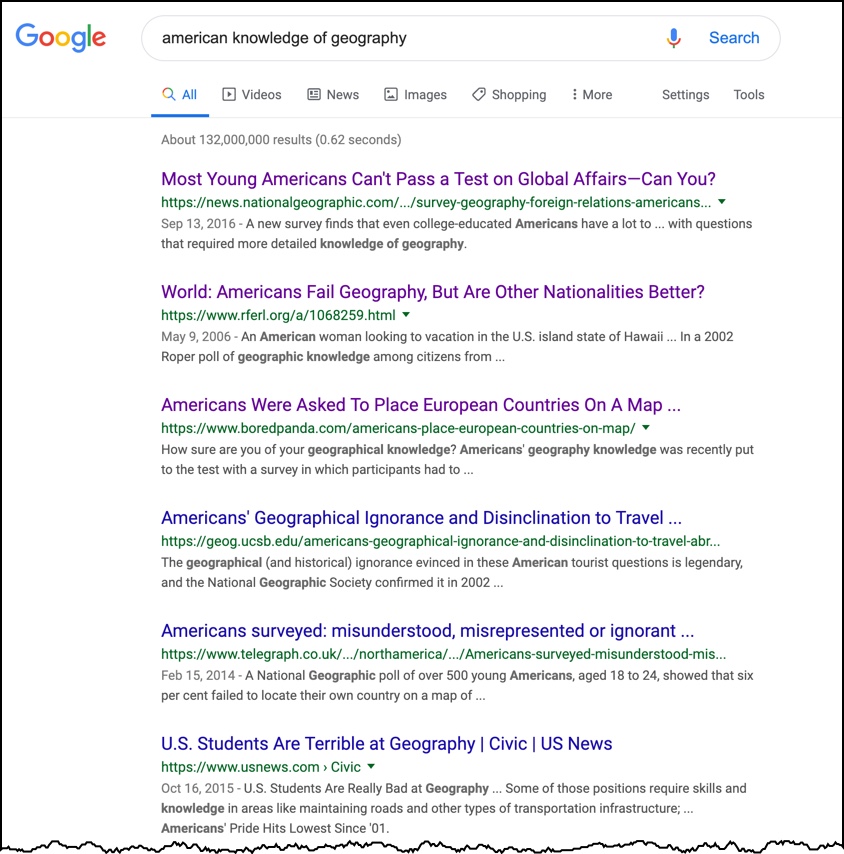
And by doing the same analysis (who wrote the article? what's their bias? why did they write this article?)
The first article is from National Geographic, a well-known (and highly reputable) source of geographic information. They cite a survey done for them by the Council on Foreign Relations about "What College-Aged Students Know About the World: A Survey on Global Literacy." The upshot?
The average score was 55% correct. Just 29% of respondents earned a minimal pass—66 % correct or better. And just over 1 percent—17 out of the 1,203 surveyd—earned an A, 91% or higher.
Respondents exhibited limited knowledge of issues critical to the United States. Only 28 percent of respondents knew that the United States is bound by treaty to protect Japan if it is attacked.
This doesn't really surprise me. I live in a United States that is profoundly inward-looking. Just out of curiosity I asked [ how many US citizens have a passport ] and found that about 37% of the population has one, compared to Canada’s 60% and the United Kingdom’s 75%. This means that nearly 2 out of 3 Americans can’t even fly to Canada, let alone travel to anywhere else in the world (according to a report from the geography department at UC Santa Barbara).
But it's distressing. While doing the research for this article I ran across a 2017 New York Times story, If Americans Can Find North Korea on a Map, They’re More Likely to Prefer Diplomacy, which includes this sobering image. With North Korea in the news on a daily basis, wouldn't you expect a more accurate hit rate?
 Data collected by the New York Times. From "If Americans Can Find North Korea on a Map..."
Out of 1.746 US adults who were asked to click on the location of North Korea (on an unlabelled map), only 36% got it right. The light blue dots are all of the incorrect locations. This is crazy.
This has a real-world consequence. As the author, Kevin Quealy writes:
"An experiment led by Kyle Dropp of Morning Consult from April 27-29, conducted at the request of The New York Times, shows that respondents who could correctly identify North Korea tended to view diplomatic and nonmilitary strategies more favorably than those who could not.."
The only factor (e.g. gender, age, education, etc.) that seemed to make much of a difference in locating Korea on a map was "Do you know someone of Korean ancestry?"
Once again, we have much to do to help our students (and ourselves) understand the world at large. We live in an international web of countries and businesses--it's useful to at least know where they are!
Search Lessons
There's an obvious point here about the remarkable lack of knowledge in mathematics and geography, but that's not the goal of SearchResearch (although I personally feel this is a terrible state of affairs).
The SRS Lessons are:
1. To find reliable data, look for data sets. If an author isn't showing you the data, be skeptical. Reliable places tend to link to their open data. If that's not happening, be skeptical.
2. Our query pattern [ American knowledge of X ] seems to work pretty well. I'd be curious to hear from SRS readers if this works well in other countries. What did YOU find worked?
3. Parallel browsing (by opening tabs from the SERP within the window), and then going deep on a topic in a new window, is a remarkably efficient way to do quick broad-brush research.
Note: I'm about to set out on two weeks of travel in a place that might (or might not) have an internet connection. I'll try to post next week, but if I don't post, don't worry--I'm just having too much fun diving in some exotic corner of the world!
Search on!
July 4, 2019
Answer: How much DO we know about history / math / geography?
HA!
You thought I'd gone away. But no, it was just another busy couple of weeks. Got the chance to give an invited talk at the American Library Association (in DC) all about the book, and then I was a discussant for a wonderful paper about interruptions at the Human Computer Interaction Consortium conference at Pajaro Dunes (near Monterey, CA). Those were both a lot of work, but also inspiring and extraordinarily interesting.
But it put me behind schedule. So, here I am, back with you again to see what SRS we can do about how much DO people know about history, about math, or about geography?
The key question was this: how would you assess "our" level of knowledge in these three areas? What does the "public" really know?
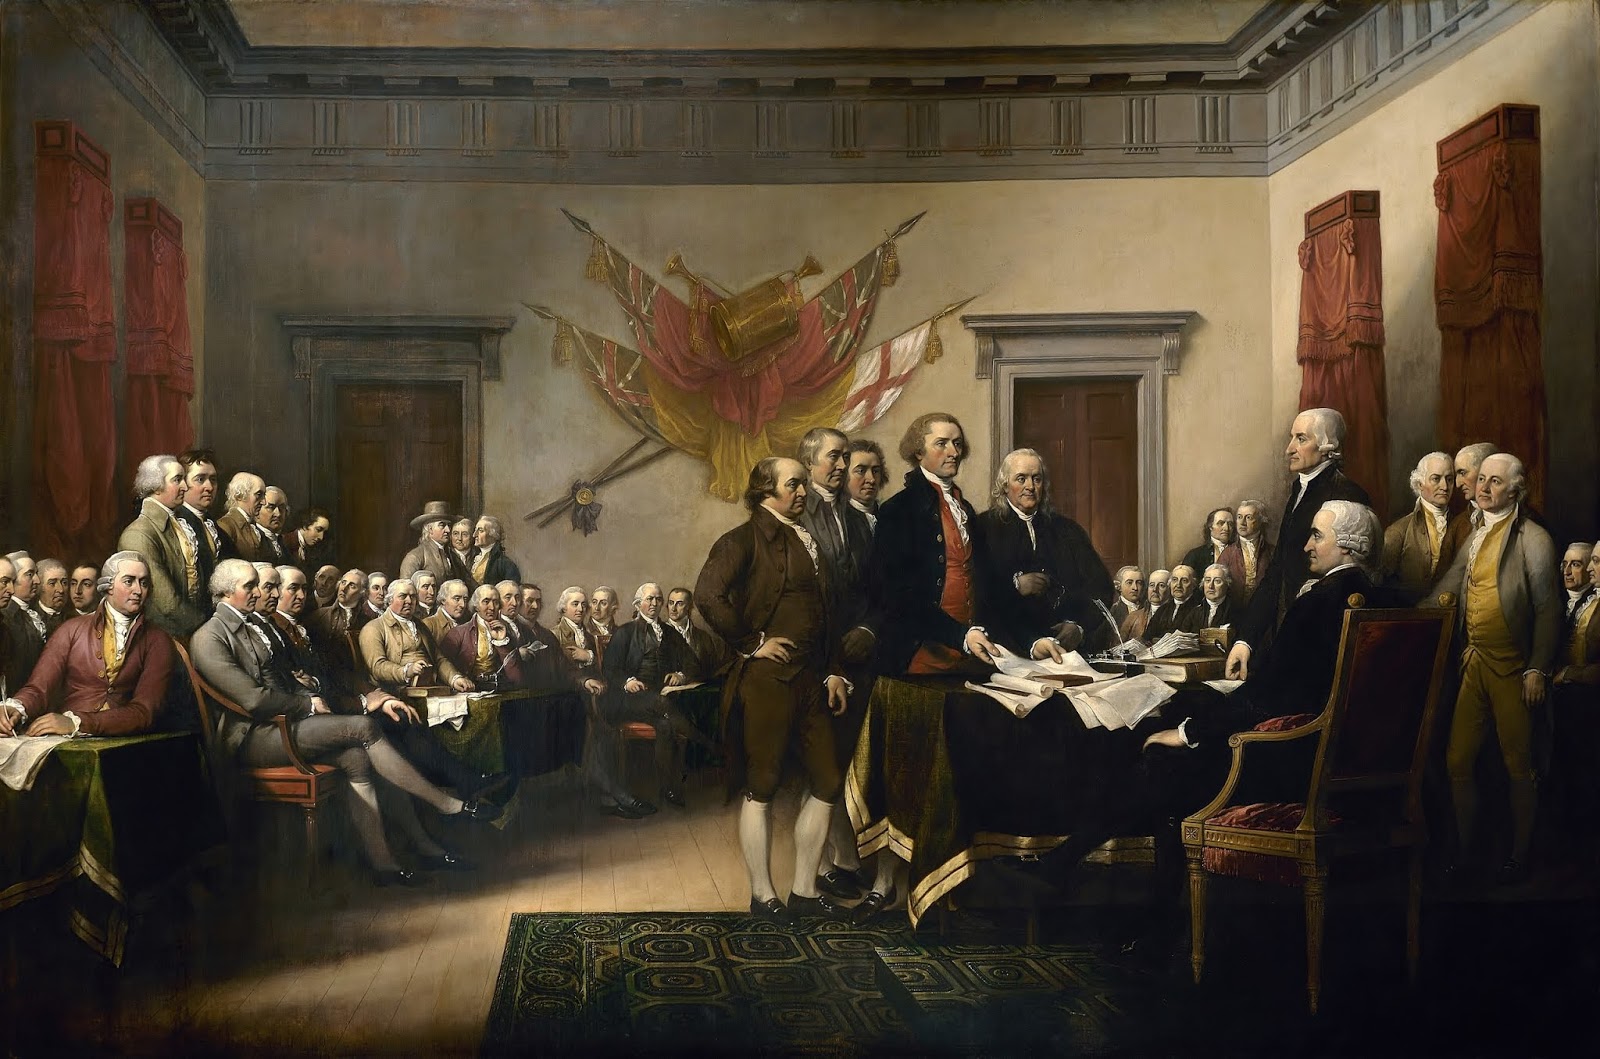 Figure 1. How many Americans can describe the Declaration of Independence and what role it played in the US Revolutionary war? Does it matter if you know what year this document was signed? (Painting by John Trumbull, 1817-1819)
 Our Challenge: What DO we know, and how to we know what we know?
1. Can you find a high-quality (that is, very credible) study of how well the citizens of the United States (or your country, if you're from somewhere else) understand (A) history, (B) geography, (C) mathematics?
As always, I'm always looking for new ways to answer questions like this. (That is, really difficult questions to search for.) It's easy and short to ask this type of question, but what do you DO?
I realize that this is going to take a bit of explaining--so I'm going to break up my answer into 2 separate posts. This is Part 1: "How much do we understand about history?" I'll do part 2 later this week.
As I started thinking about this, it became obvious that there are a couple of key questions that we need to list out. In the book I call these "Research Questions," and that's what they are. I recommend to searchers that they actually write these down--partly to help organize your notes, but also partly to make it VERY clear what you're searching for! In essence, they help to frame your research.
A. "How much do we...?" Who is "we"? For my purposes, I'm going to limit "we" to currently living people in the US. We'll touch on global understanding later, but for this round, just US. (Of course, if you live in another country, you should do your place!) I'm hoping we can find data to measure this across the range of ages, although it might be simpler to find just student data to begin with.
B. ".. know about history?" How are we going to measure this? Ideally, we'd give some kind of history test to everyone in the US--but that's not going to happen. An important question for us is what will count as a proxy measurement of historical knowledge? (That is, what's a good way to measure historical knowledge? What organization is giving the survey/test/exam?)
Also, another underspecified part of this question is "..about history?" Are we trying to measure World History, or just US History knowledge?
C. "How well..." What does it mean to measure "how well the citizens .. understand..."? All tests implicitly have a standard, an expectation that they're measuring against. In this case, how should we measure "how well"? We'll have to figure this out when we learn how "citizen history understanding" is gauged.
I started with the obvious query:
[ US knowledge of history ]
I wasn't sure if this would work, but it gave some pretty interesting results, including a big hint that "American" is probably a useful search term:
 Figure 2.
 For this kind of topic (that is, one that I'm not sure where to begin) I opened a bunch of tabs in parallel. s: (on a Mac, you CMD+click on the link; on Windows it's Ctrl+left-click)
This is called parallel browsing [1] [2] and is a great way to look at a topic across its range without getting stuck in one particular interpretation. When parallel searching, your goal is to see the spectrum of opinions on a topic. In particular, you'll want to pay attention to how many different sources you're seeing, and what sources you're reading.
Note how I've opened all of the top 7 search results in parallel:
 Figure 3
Now, I can look at a bunch of these results and compare them. But, as always, you want to scan the result AND check for the organization (and author). For instance, in the above SERP there are results from TheHill.com, NationalReview.com, NAS.org, Historians.org, TheAtlantic.com, VOANews.com, and SmithsonianMag.com
Let's do a quick rundown of these sources. The best way I know to do this is to (1) go to the organization's home page and do a quick overview scan; (2) search for the name of the organization, looking for articles about the org from other sources (and points of view); (3) search for the name of the org along with the keyword "bias." Here's an example of what my screen looks like when I'm in mid-review, in this case, I'm checking out the American Historical Association (that is, Historians.org)...
 Figure 4. Click on this window to see it full size--that's the only way you can read the text!
 In the bottom window you can see the AHA article about "Chapter 2: Why Should Americans Study History" (that's link #4 in Figure 3). In the right window you can see my query: [ "American Historical Association" bias ] -- this is a quick way to see if anyone else has written about possible biases in that org. In this case, the AHA org seems pretty kosher. There are articles about AHA that discuss their attempts to fight bias in various forms, but nobody seems to have written about their bias. (If you try this bias context term trick on the other orgs in this SERP, you'll find very different results.)
An important SRS point to make: I open tabs in parallel as I'm exploring the main SERP, but I open a new window when I'm going to go in depth on a topic (and them open parallel tabs in there, rather than in the first window).
In the lower left window you'll see the Wikipedia article about AHA. You can see that it's been around for quite a while (chartered in 1884) as an association to promote historical studies, teaching, and preservation. The Wiki version of AHA is that it's a scholarly org with an emphasis on collaboration as a way of doing history. That's important, as it suggests that it's a reasonably open organization.
Now.. back to our task of checking on the stance of each of these sources.
I'll leave it to you to do all of the work, but here's my summary of these sources:
TheHill.com - a political news newspaper/magazine that claims "nonpartisan reporting on the inner workings of Congress and the nexus of politics and business." AllSides.com (a bias ranking org) finds it a bit conservative
NationalReview.com - shows up consistently as very conservative. (AllSides.com and Wikipedia agree.
NAS.org (National Association of Scholars) - pretty clearly "opposes multiculturalism and affirmative action and seeks to counter what it considers a "liberal bias" in academia.
Historians.org - (American Association of Historians) - multi-voice, collaborative institution of long standing that tries to represent an unbiased view of history.
TheAtlantic.com - news magazine with a slightly left-of-center bias.
VOANews.com (Voice of America) - is part of the U.S. Agency for Global Media (USAGM), the government agency that oversees all non-military, U.S. international broadcasting. Funded by the U.S. Congress.
SmithsonianMag.com - rated by Media Bias Fact Check as a "pro-science" magazine with a good reputation for accuracy.
NOW, with that background, what do we have in that first page of results?
TheHill.com reports that
"...Only one in three Americans is capable of passing the U.S. citizenship exam. That was the finding of a survey recently conducted by the Woodrow Wilson National Fellowship Foundation of a representative sample of 1,000 Americans. Respondents were asked 20 multiple choice questions on American history, all questions that are found on the publicly available practice exam for the U.S. Citizenship Test."Okay, now we have to go still deeper and do the same background check on the Woodrow Wilson National Fellowship Foundation. Using the method above, I found that it's a nonprofit founded in 1945 for supporting leadership development in education. As such, they have a bit of an interest in finding that they're needed--for instance, to help teach history and civics.
But the survey mentioned above was actually conducted by Lincoln Park Strategies, a well-known political survey company that's fairly Democratic, but also writes extensively on the reliability of surveys. (So while I might tend to be a little skeptical, a survey about historical knowledge is likely to be accurate.)
The key result from this survey is that only 36% of those 1,000 citizens who were surveyed could pass the citizenship test. (See a sample US citizenship test and see if you could pass!) Among their findings, only 24 percent could correctly identify something that Benjamin Franklin was famous for, with 37 percent believing he invented the lightbulb.
Note that this survey implicitly answers Research Questions B and C (from above): How do we measure historical knowledge? Answer: By using the Citizenship Test. And, How well do people do on the test? Answer: A "good" grade would be passing, that is, the passing grade for a new citizen.
What about the other sources?
The National Review article reports on a 2016 American Council of Trustees and Alumni report that historical knowledge is terrible ("... less than a quarter of twelfth-grade students passed a basic examination [of history] at a 'proficient' level.").
Now we have to ask again, who/what is the "American Council of Trustees and Alumni"? The short answer: part of a group of very conservative "think tanks" and non-profits that are closely linked to far-right groups (e.g., the Koch Brothers).
So, while that information could well be true, we realize that there's an agenda at work here. (I did look at their survey method as reported in the report above, and it seems reasonable.)
Meanwhile, the National Association of Scholars points to the US Education Department’s National Assessment of Educational Progress quadrennial survey, The Nation’s Report Card: U.S. History 2010. Looking at the original report shows that the NAS article accurately reflects the underlying data. While average scores on the test have improved over the past several years, the absolute scores are terrible. As they write: "...20 per cent of fourth grade students, seventeen per cent of eighth graders, and twelve per cent of high school seniors performed well enough to be rated “proficient.” It looks even worse when you invert those positive figures: eighty per cent of fourth graders, eighty-three per cent of eighth graders and eighty-eight per cent of high school seniors flunked the minimum proficiency rating."
Wow. That's pretty astounding.
Continuing onward:
The Historians.org article ("Chapter 2: Why Should Americans Know Their Own History") is an argument for teaching history, but has no data in it. However, Chapter 1 of the same text at the same site talks about the data, but the crucial figure is MISSING. (And I couldn't find it.) So this doesn't count for much of anything.
In that same vein, The Atlantic's article "Americans vs. Basic Historical Knowledge" is really a reprint from another (now defunct) journal, "The Wire." This article decries the state of American students with a bunch of terrifying examples, but it points to yet another set of data that's missing-in-action.
The VOA article, "Poll: Americans’ Knowledge of Government, History in ‘Crisis'" is also ANOTHER reference to the American Council of Trustees and Alumni survey of 2016 (referred to as the data source for the National Review article). This article is basically a set of pull quotes from that report.
What about the pro-science magazine, Smithsonian? Their article, "How Much U.S. History Do Americans Actually Know? Less Than You Think" says that the 2014 National Assessment of Educational Progress (NAEP) report found that only 18 percent of 8th graders were proficient or above in U.S. History and only 23 percent in Civics. (See the full report here, or the highlights here.)
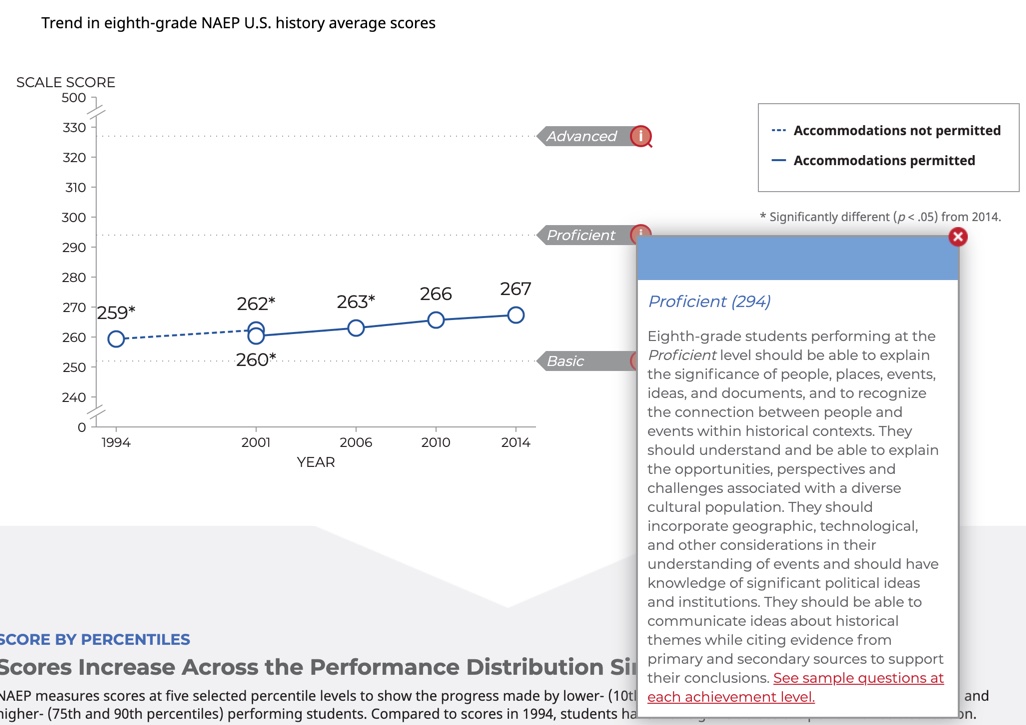 Figure 5. NAEP history test scores for 8th graders, 1994 - 2014.Figure 5 shows an excerpt from the full report, and when I saw it I thought it looked awfully familiar.
 Remember the National Association of Scholars article from a few paragraphs ago? Yeah, that one. Turns out that this article and that article both point to the same underlying data. That is, the National Assessment of Educational Progress (NAEP)! This article points to the updated 2014 report (while the earlier article's data is from 2010). This doesn't count as a really new data set, it's just an update of what we saw earlier. What's more, the update in four years isn't statistically different. It doesn't count as a separate reference!
Sigh.
So what we have here, in the final analysis of the 7 webs pages are:
a. the NEAP data set (from 2010 and 2014)
b. the American Council of Trustees data set (2016)
c. the Woodrow Wilson survey (which has a summary, but not much real data)
Everything else is either missing or a repeat.
I went through the next couple of SERP pages and while I found lots of articles, I found that almost all of them basically repeat the data from this handful of studies.
As it turns out, these three (and the few other studies I found that were about specific historical questions, rather than history broadly speaking) all agree: We're not doing well. In particular, on normed tests, or the Citizenship test, Americans don't seem to know much about their history.
Of course, this alarm has been raised every few years since at least 1917 when Carelton Bell and David McCollum tested 668 Texas high school students and found that one third of these teens knew that 1776 was the date of the Declaration of Independence. [3] Like that.
It's a sobering thought do consider this on the July 4th holiday. (Which is, coincidentally, our agreed-upon celebration date of the signing--even though it took several days to actually sign the document, as the signatories were scattered across several states!) Like Bell and McCollum, I worry... but perhaps this is an inevitable worry. To me, it suggests that teaching and education need to remain permanent features of our intellectual landscape.
As should search.
Search on!
Search Lessons
There's much to touch on here...
1. You have to go deep to look for redundancy. Just because we found 10 separate articles does NOT mean that there were 10 different studies that all agree. In this set of articles, there are really 3 common pieces of data.
2. Use parallel browsing to open up tabs that branch off the same SERP, and then use different windows to go deep on a particular topic. That's what I do, and it certainly makes window management simpler!
3. Beware of lots of 404 errors (page not found). If a publication can't keep references to their own pages up to date, you have to admit to being skeptical of their work overall. It's inevitable to get some link-rot errors, but they shouldn't be common, as they were in some sites I visited here. (Hint: If you want to write scholarly text that lasts, make sure you keep a copy of the data your article depends upon.)
[1] "Parallel Browsing Behavior" Huang and White. Proceedings of the 21st ACM conference on Hypertext and hypermedia. ACM, 2010.[2] "Online multitasking and user engagement." Lehmann, Janette, et al. Proceedings of the 22nd ACM international conference on Information and Knowledge Management. ACM, 2013. [3] Bell, J. Carleton, and David F. McCollum. "A study of the attainments of pupils in United States history." Journal of Educational Psychology 8.5 (1917): 257.