
Yield Curve, February 11th
Given worries regarding an imminent slowdown in the wake of the stock market decline, it’s of interest to see what the term premium is signalling.
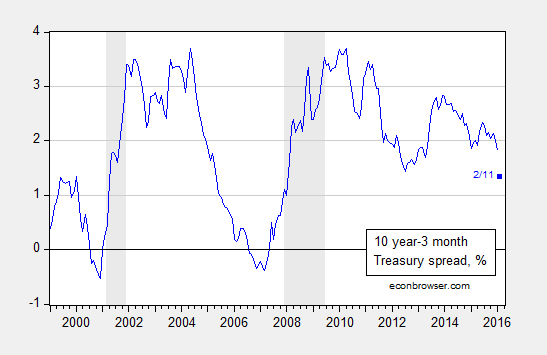
Figure 1: Ten year minus three month Treasury yield spread, % (blue). February observation is for 11 February. NBER defined recession dates shaded gray. Source: FRB via FRED, NBER, and author’s calculations.
Estimating a standard probit model for recessions based on one year lagged term spread over the 1986-2015 period (encompassing the “Great Moderation”) yields:
Prob(recession=1)t = -0.145 – 0.863×spreadt-12 ut
McFadden-R2 = 0.30. NObs = 350.
Where bold denotes significance at 1% msl, using Huber-White standard errors. Using a 20% threshold, the model predicts recession dates correctly 78% of the time, and no recession dates 85% of the time.
The spread on 11 February was 1.35 percentage points. Putting this into the estimated equation yields a value of -1.31, implying a 9.5% probability of a recession within the next year. This is a slightly different probability than that reported in this post due to the flattening of the yield curve since January 11th, and a slightly different sample period (the previous used 1970-2013).


Menzie David Chinn's Blog


