
Managing the Fed’s balance sheet
Last week I discussed the tools that the Federal Reserve will be using to raise short-term interest rates as we enter the next phase of U.S. monetary policy. In brief, the Fed plans to use interest on reserves and reverse repurchase agreements as an offer to borrow back Federal Reserve deposits at an annual rate between 25 and 50 basis points (0.25% to 0.50% interest per year). That offer from the Fed puts an effective floor under the fed funds rate, which is the rate at which institutions would lend these funds overnight to other banks. When the Fed raises its offering rate, the fed funds rate should go up with it. Today I look at the implications of these new procedures for the Fed’s balance sheet.
Large banks and certain other financial institutions have accounts with the Federal Reserve known as Federal Reserve deposits. The Fed has the ability to acquire new assets (securities it buys or loans that it makes) simply by crediting the counterparty’s account with the Fed with a new balance. When it does so, the Fed’s assets go up by the value of the securities or loan, and its liabilities go up by the same amount in the form of new Fed deposits.
The graph below records the Federal Reserve’s assets each week since the end of 2002. Up until 2007 these consisted almost entirely of Treasury securities (shown in blue). In response to the financial crisis, the Fed made a series of emergency loans (shown in brown) through facilities such as Term Auction Credit and the Commercial Paper Lending Facility (now no longer used) as well as large loans to foreign central banks in the form of currency swap agreements (in green). These roughly doubled the Fed’s total asset holdings by the end of 2008. As emergency loans were repaid, the Fed opted to maintain and then increase its assets through purchases of new Treasury securities and mortgage-backed securities in three separate phases of what are popularly referred to as “quantitative easing” or QE1, QE2, and QE3. Since the end of 2014 the Fed has kept its assets constant, only buying securities to replace those that mature. The current value of Fed assets is $4.5 trillion, five times as large as it had been near the end of 2007.
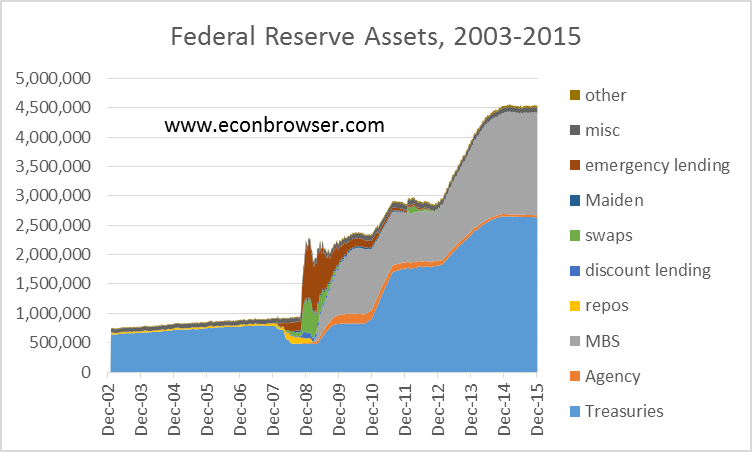
Federal Reserve assets in millions of dollars, Wednesday values, Dec 18, 2002 to Dec 23, 2015. Data source: Federal Reserve Statistical Release H.4.1. Treasuries: Treasury securities held outright plus unamortized premium net discount on all securities; Agency: Federal agency debt securities; MBS: mortgage-backed securities; repos: repurchase agreements; discount lending: primary, secondary and seasonal credit; swaps: central bank liquidity swaps; Maiden: net portfolio holdings of Maiden Lane LLC; misc: sum of float, foreign currency denominated assets, gold, special drawing rights, and Treasury currency outstanding; other: other Federal Reserve assets; emergency lending: Federal Reserve Bank credit minus sum of the preceding.
The graph below displays the Fed liabilities associated with these assets. For every week, the height of the graph below is exactly equal (by definition) to the height of the graph above. Up until 2007, most of the deposits that the Fed created ended up being withdrawn as currency held by the public (shown in blue), and indeed, providing for the gradual increase in currency demand each year was the primary reason that the Fed was slowly adding to its holdings of Treasury securities each year prior to 2007.
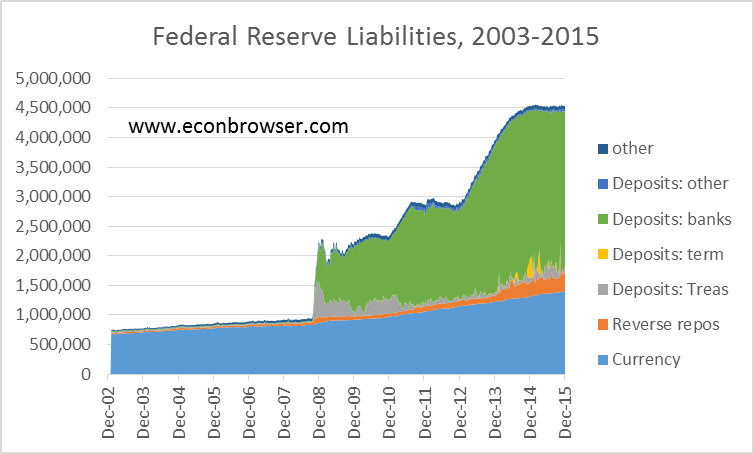
Federal Reserve liabilities in millions of dollars, Wednesday values, Dec 18, 2002 to Dec 23, 2015. Data source: Federal Reserve Statistical Release H.4.1. Currency: currency in circulation; reverse repos: reverse repurchase agreements; term deposits: term deposits held by depository institutions; other deposits: deposits held by foreign official and other nonbank accounts; Treas deposits: deposits held by Treasury plus required reserves, calculated as deposits other than reserve deposits minus previous two items; bank deposits: reserve balances with Federal Reserve Banks; other: Treasury cash holdings plus other Federal Reserve liabilities and capital.
Once the Fed has created new deposits, nothing an individual bank could do apart from withdrawing the deposits as cash would make the deposits disappear. If a bank makes a loan to a customer of another bank, the result of the loan is the deposits just get transferred from the first bank to the second with the total end-of-day Fed deposits of all banks unchanged. But the volume of Fed operations beginning in 2008 far exceeded that needed to meet demand for currency. Initially the Treasury held some of the extra deposits that the Fed was creating in the Treasury’s own account with the Fed, as seen in gray in the figure above. But with interest rates so low and the Fed offering to pay 25 basis points on reserves, banks were quite willing to hold the reserves at the end of each day rather than try to invest or lend out these funds themselves. Banks would make loans or investments during each day, of course, transferring the deposits between banks. But at the end of the day some bank was perfectly willing to hold the deposits overnight rather than try to make one more investment. The result is that most of the new Fed liabilities that have been created since 2008 have simply remained as deposits held on account with the Fed.
As we enter the era when interest rates are no longer stuck at zero, banks could still be persuaded to hold the existing volume of deposits each night by raising the interest rate that the Fed offers to pay on deposits. The Fed also has a couple of other tools that it can use to absorb some of the excess reserves. One is the Term Deposit Facility, through which a bank agrees to maintain a specified level of reserves each night on deposit with the Fed for an extended period. The Fed has conducted a number of operational experiments with this facility over the last several years, and found that banks were willing to commit term funds for a premium of just a few basis points above the interest rate paid on reserves. These operational tests can be seen in the yellow spikes in the graph above. Note that they were always matched by offsetting contractions in the green area (total bank deposits) so that the sum of bank deposits plus term deposits was unaffected. This experience suggests that the Fed can successfully use this tool to lock up deposits for short periods.
A second tool is provided by reverse repurchase agreements, in which the Fed essentially “borrows” the deposits overnight from a depository institution, temporarily delivering an equivalent sum from its securities holdings as collateral. The operation is then reversed the next day, with the Fed getting back its securities, and the counterparty getting back its deposits plus interest. In terms of its balance sheet, the Fed continues to claim the securities as among its assets, but adds the reverse repo as a liability (shown in orange in the second graph). Prior to December 16, reverse repos only paid 5 basis points at an annual rate, and so were primarily of interest only to institutions like the Federal Home Loan Banks that were ineligible to receive the 25 basis points interest on reserves.
Here’s a blown-up graph of Fed liabilities during 2015. The experience with reverse repos, like that of term deposits, was that the Fed can absorb deposits fairly reliably with these operations.
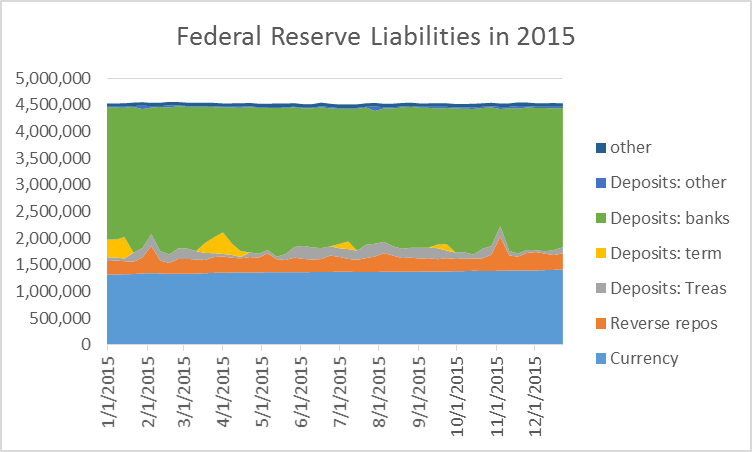
Federal Reserve liabilities in millions of dollars, Wednesday values, Jan 7, 2015 to Dec 23, 2015.
Beginning with the last week on the above graph (Dec 17-23), the reverse repos were no longer being used in test mode and we began the real deal. All the Fed did was announce that the reverse repos would pay 25 basis points instead of the 5 basis points they had been offering in operational experiments. The Fed simultaneously announced that banks could earn 50 basis points instead of 25 basis points on reserves held overnight. Although there was an $83 billion increase in reverse repos observed during this week, the magnitude is not that unusual relative to what we’d been seeing earlier in the year.
Although not much happened in terms of the Fed’s balance sheet this last week, the action in the fed funds rate was exactly as intended. The rate jumped up immediately from 15 bp on Dec 16 and has stayed at 36-37 bp since.
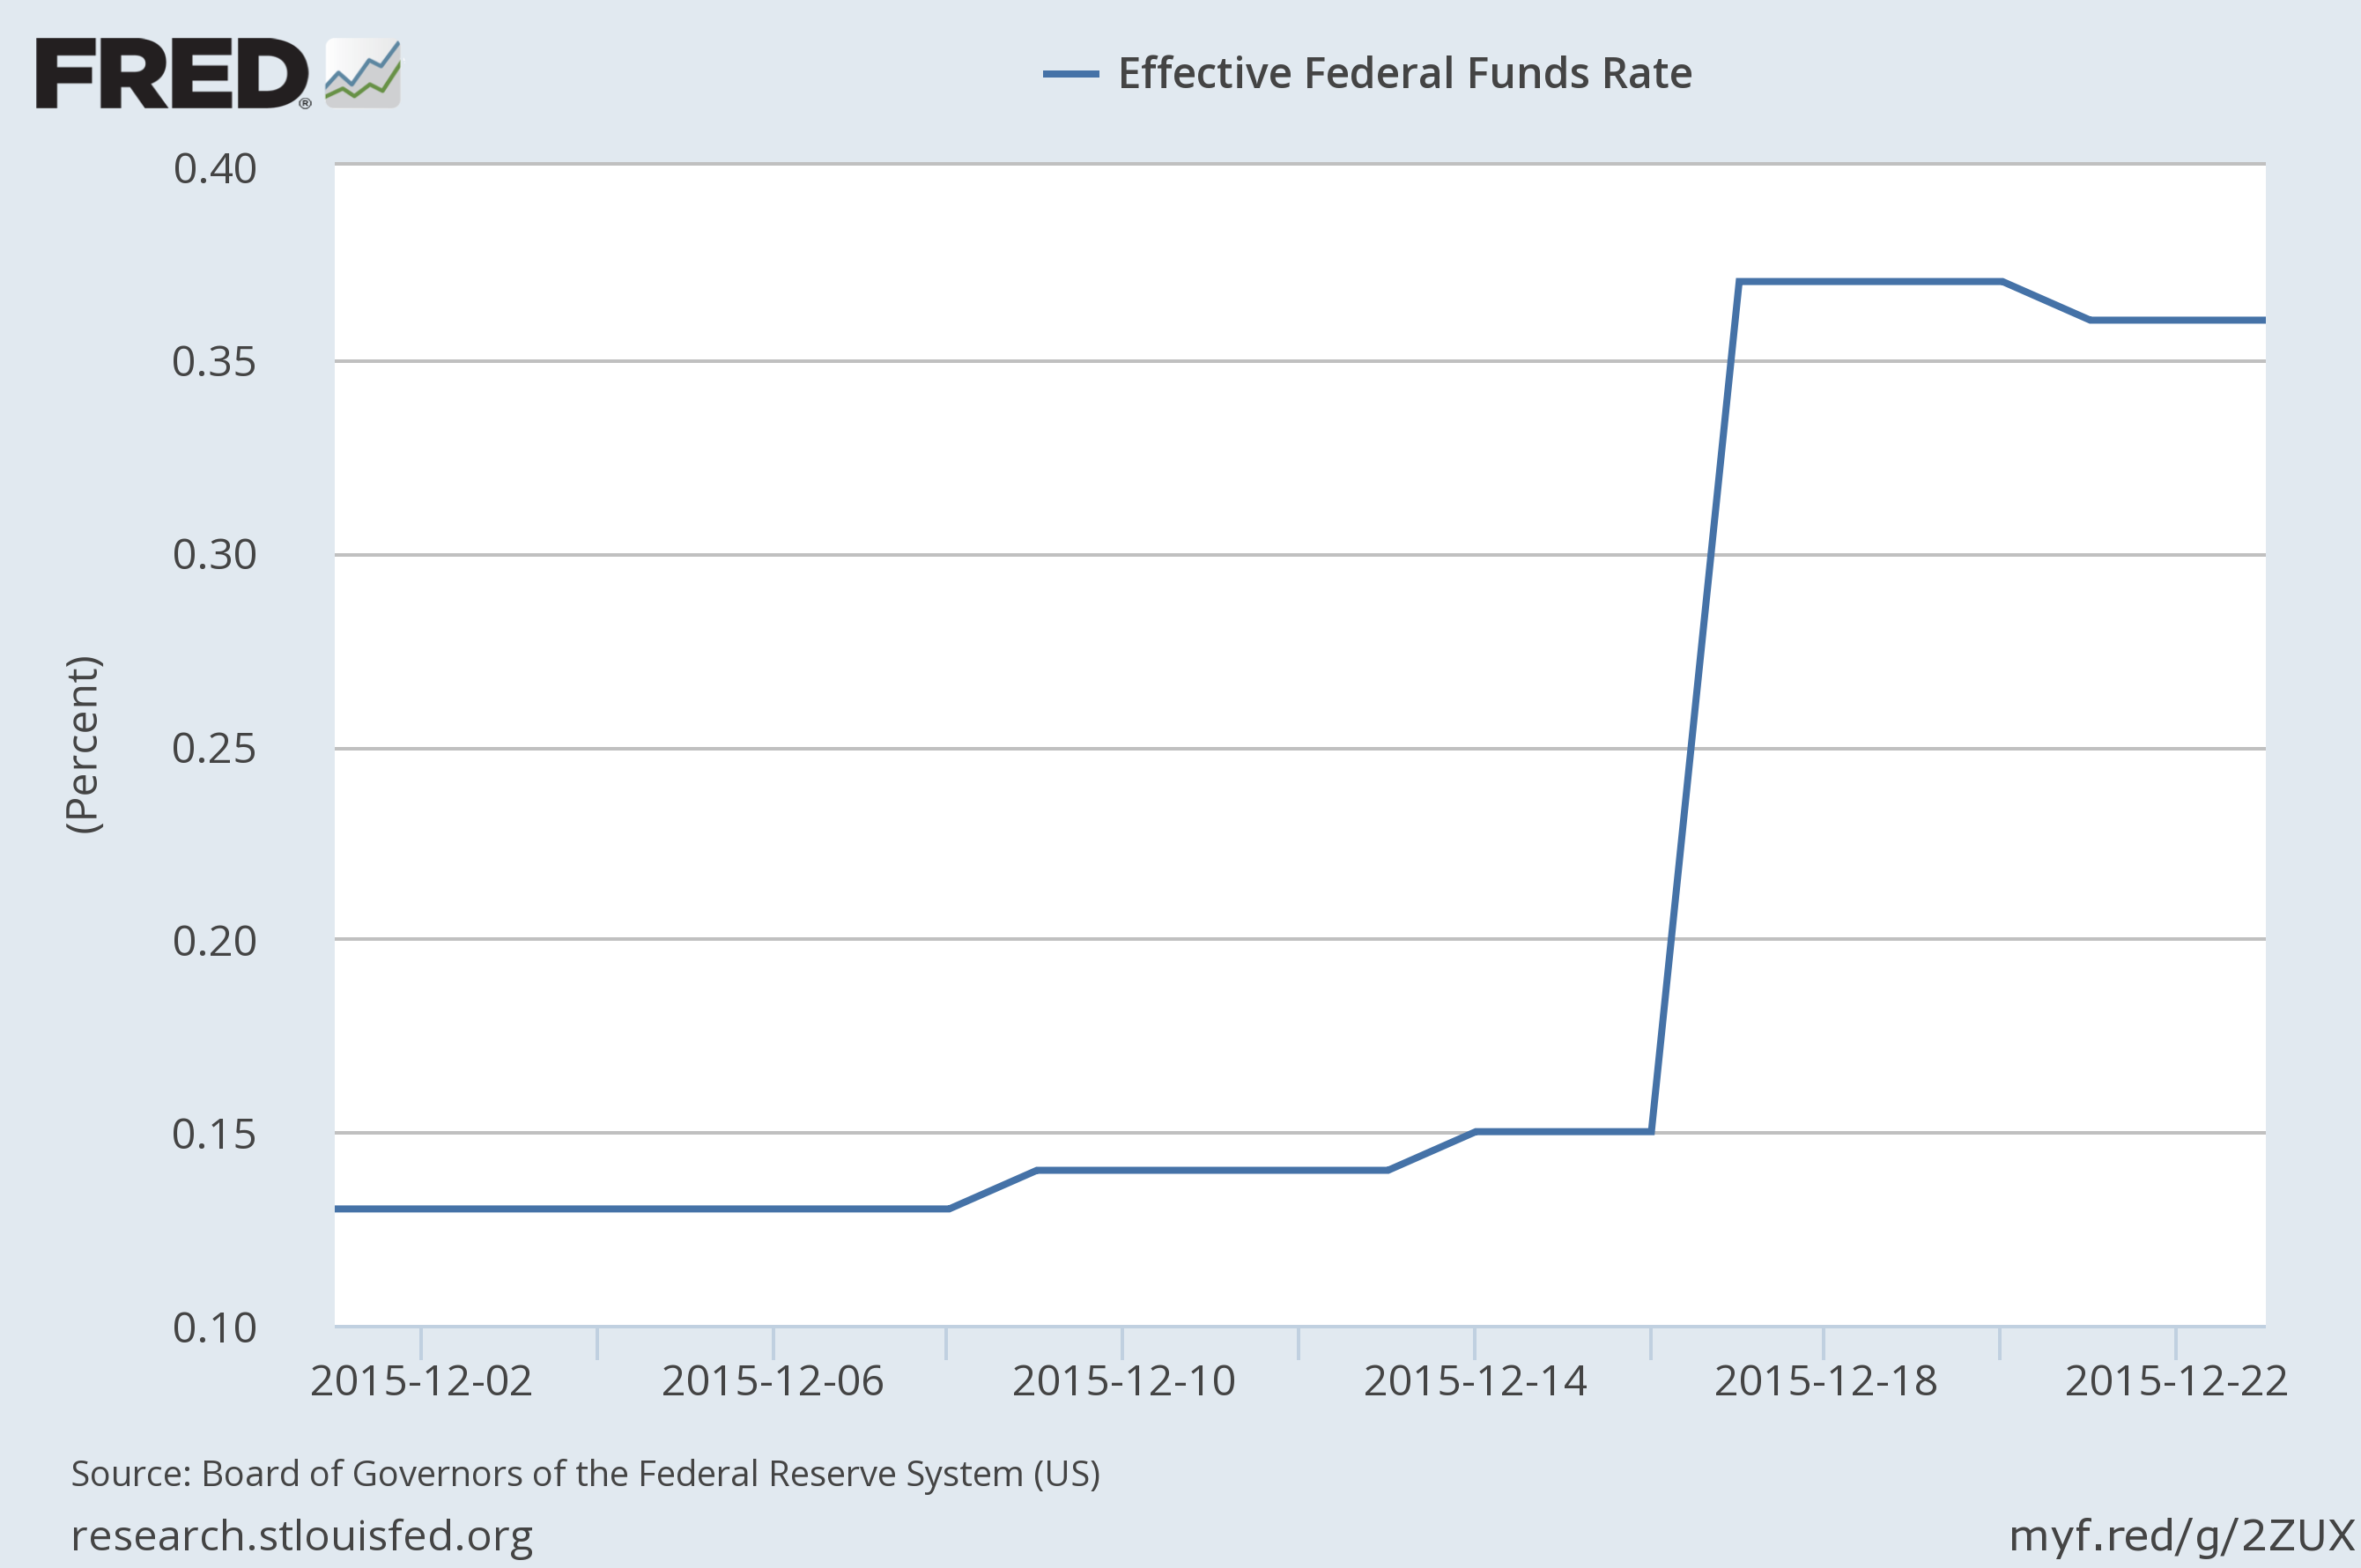
Volume-weighted average rate on brokered fed funds loans, Dec 1 to Dec 23. Source: FRED.
To summarize, although the tools of implementing monetary policy have changed, the fundamentals are as they had been before 2007. Namely, Fed policy is best understood as setting a target for the interest rate rather than in terms of a goal for a monetary aggregate such as the level of reserves or broader M1. The Fed’s primary decision is when to change its interest rate target. For the time being, the Fed has the ability to manage its large balance sheet in a manner consistent with its chosen target.


Menzie David Chinn's Blog


