
How Are Emerging Markets Responding to Anticipated US Tightening?
Just back from England and a couple of presentations, one at the CCBS on the Trilemma and monetary policy spillovers. Here are three graphs, related to the presentation, which illustrate how policymakers in different emerging market countries are responding to the stresses their economies are undergoing.
I limit the examination to the BRICs (Brazil, Russia, India, and China) as well as other countries, some of which are included in the “Fragile 5”; the additional countries are South Africa, Indonesia, Mexico, and Turkey. I proxy US monetary policy with the Wu-Xia shadow Fed funds rate, first discussed by Jim in this post.
Recall, in a Mundell-Fleming framework under a quasi-fixed exchange rate, and imperfect capital mobility (notes here), policymakers can respond either by allowing currency depreciation, raising policy rates, or depleting foreign exchange reserves.
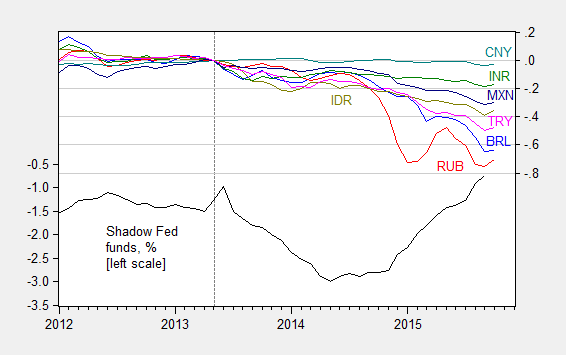
Figure 1: Shadow Fed funds rate, in % (black, left scale), log exchange rate against USD, where down is depreciation, for Brazil (blue), Russia (red), India (green), China (teal), South Africa (purple), Indonesia (chartreuse), Mexico (dark blue), and Turkey (pink), all normalized to 2013M05=0, right scale. October data is through October 14th. Source: FRED, Wu-Xia, Pacific Exchange Services and author’s calculations.
It’s interesting to note the wide divergence in depreciations (although one should recall these are rates expressed against the USD, which has appreciated strongly over the last fourteen months). Also, the anticipation of monetary tightening in the US, as measured by the shadow Fed funds rate, is not the only factor stressing emerging markets. The VIX, a key determinant of emerging market exchange rates and current account balances [1] [2] [3], has been slightly elevated as well in the last couple of months.
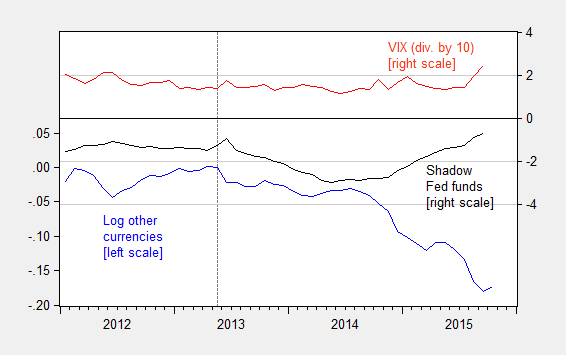
Figure 2: Shadow Fed funds (black, right scale), VIX divided by 10 (red, right scale), and log other important US trading partners currencies index (Federal Reserve) normalized to 2013M05=0 (blue, left scale). Source: FRED, Wu-Xia and author’s calculations.
As shown in Figure 3, some countries have opted for an interest rate defense; the Russian Federation early on embarked upon a vigorous defense, with rates still elevated (by the way, I think the book still is to be written on the parsing out the efficacy of financial sanctions vs. the weakness of oil prices in pressuring the Russian economy.) Brazil is clearly the most obvious case of an interest rate defense.
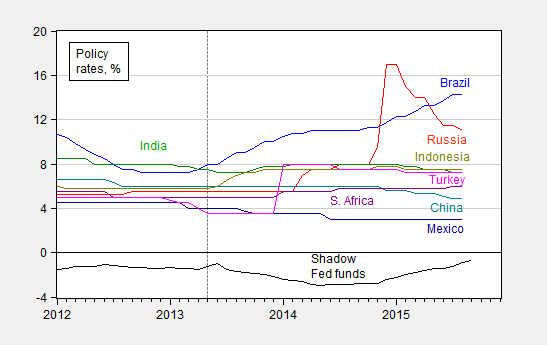
Figure 3: Shadow Fed funds rate (black), policy rates for Brazil (blue), Russia (red), India (green), China (teal), South Africa (purple), Indonesia (chartreuse), Mexico (dark blue), and Turkey (pink). October data is through October 14th. Source: FRED, Wu-Xia, Pacific Exchange Services and author’s calculations.
While Russia has relented on policy rate increases, it’s interesting to note that reserve decumulation (Figure 4) has — in percentage terms — been much more marked for that country. In log terms, reserves are now some 40% down relative to 2013M05; most of the other reserve decumulations pale in comparison.
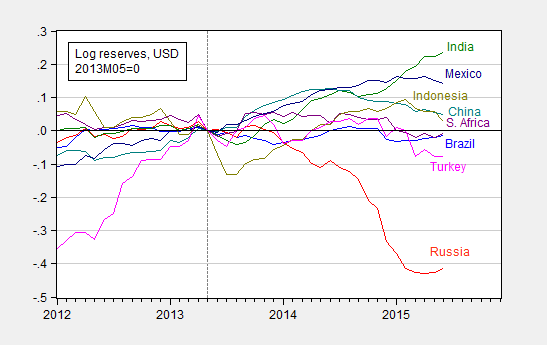
Figure 4: Shadow Fed funds rate (black), and log international reserves ex.-gold for Brazil (blue), Russia (red), India (green), China (teal), South Africa (purple), Indonesia (chartreuse), Mexico (dark blue), and Turkey (pink), all normalized to 2013M05=0. Source: FRED, Wu-Xia, and author’s calculations.
That being said, the Chinese international reserves ex.-gold in June 2015 are 7.8% down from the June 2014 peak (while September 2015 foreign exchange reserves are down 12.8% relative to June 2014 [4], in log terms).
In Aizenman, Chinn and Ito (2015), we investigate what determines the amount of stress — as measured by exchange market pressure indices — experienced by different economies, as a function of exchange rate stability, capital account openness, trade and financial linkages and a variety of other macro indicators; further discussion is in this post.


Menzie David Chinn's Blog


