
Kansas: The Collapse Continues
As does the fiscal experiment.
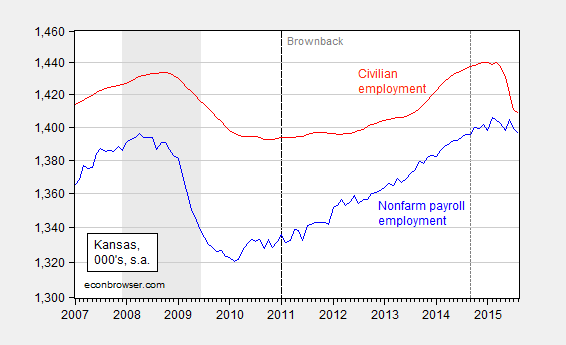
Figure 1: Kansas nonfarm payroll employment (blue), civilian employment (red), in 000’s, seasonally adjusted, Log scale. Dashed line denotes last period establishment series is QCEW benchmarked. Source: BLS.
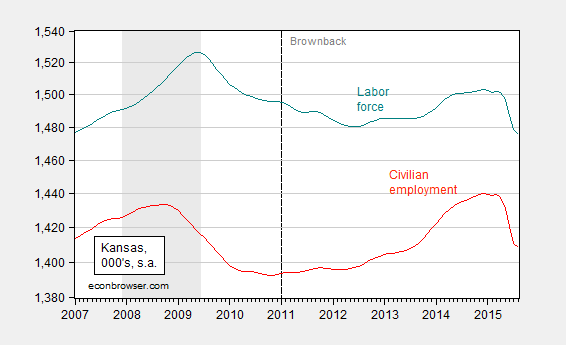
Figure 2: Kansas labor force (teal), civilian employment (red), in 000’s, seasonally adjusted. Log scale. Source: BLS.
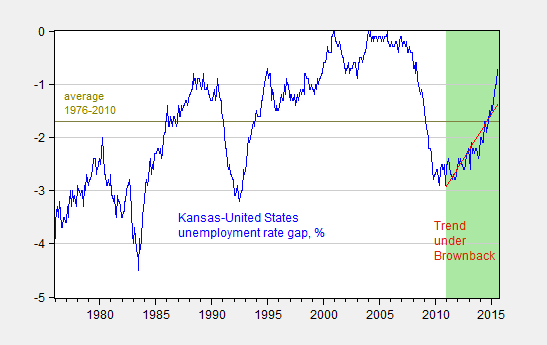
Figure 3: Kansas minus US unemployment rate, in percentage points (blue), and linear trend in this differential over the Brownback terms (red). Average over 1976-2010 (chartreuse) Green shaded area Brownback terms. Source: BLS, and author’s calculations.
Update, 9/19 9:45am Pacific: Kansas City Fed documentation of various Kansas indicators relative to Nation’s, here. The precarious state of the budget is discussed here.


Menzie David Chinn's Blog


