
“Scott Walker’s exaggerated claims of employment trends in Wisconsin”
That’s the title of WaPo’s FactChecker recap of the Governor’s misrepresentations. Three Pinocchio’s!
Here is a graphical depiction of Wisconsin private payroll employment, Governor Walker’s August 2013 promise of 250,000 new jobs by January 2015, and how long it will take to hit that target assuming employment evolves as it has since Governor Walker took office.
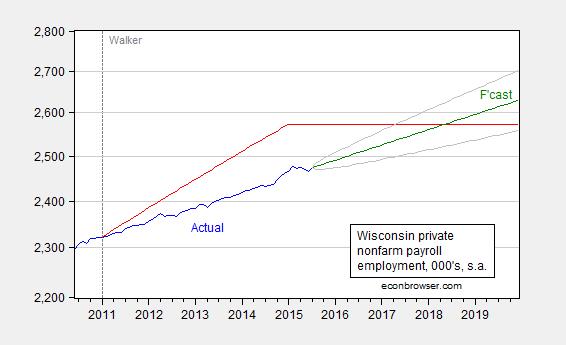
Figure 1: Wisconsin private nonfarm payroll employment (blue), and path promised by Walker in August 2013 (red), forecast from random walk with drift estimated over the 2011M01-2015M07 sample (green), and 90% band (gray). Left scale is logarithmic. Source: BLS, Milwaukee Journal Sentinel, author’s calculations.
Update: The irrepressible Rick Stryker argues that WaPo is merely pushing distortions in the guise of fact checking. Let me merely provide another graph, wherein we see how Walker’s touting of a lower unemployment rate than the US is — at the very least — misleading.
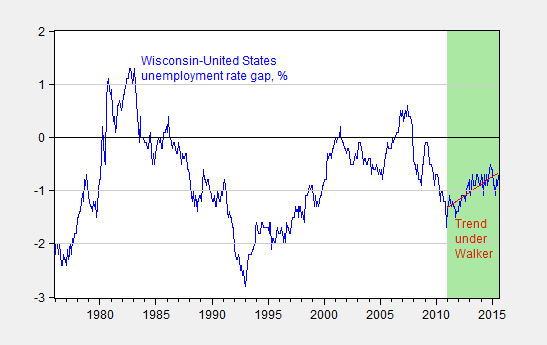
Figure 2: Wisconsin minus US unemployment rate, in percentage points (blue), and linear trend in this differential over the Walker terms (red). Green shaded area Walker terms. Source: BLS, and author’s calculations.
The graph indicates that on average Wisconsin’s unemployment rate is below the national average, so that it is nothing special to say that at the moment, Wisconsin’s unemployment rate is lower than the US.
Observers will note that the trend is upward, i.e., improvement in Wisconsin’s unemployment rate is lagging the Nation’s. The trend is 0.144 ppts per year, t-stat 5.6 using HAC robust standard errors.


Menzie David Chinn's Blog


