
Projecting 2015 Acres Burned and Firefighting Expenditures
Reader CoRev asserts wildfire intensity has not been severe of late. I’ll just some graph some data to bring reality to the interested.
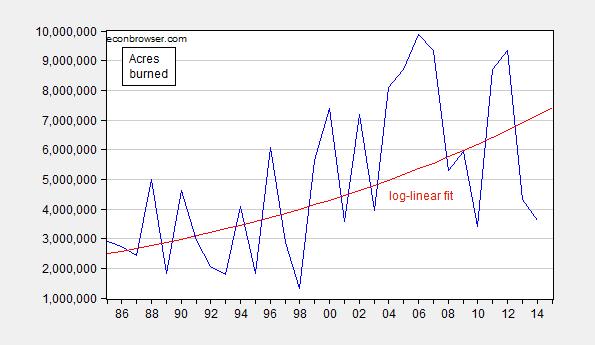
Figure 1: Acres burned (blue) and log-linear trend. Source: NIFC and author’s calculations.
Notice the upward trend; it is estimated by regressing log acres on a time trend. The t-statistic on the time trend is highly significant. The DW statistic is 1.83, the R2=0.81. Robust least squares provides a similar time trend. The coefficient on the time trend is 0.036, indicating that the acres burned trends upward at 3.6% per year (in log terms).
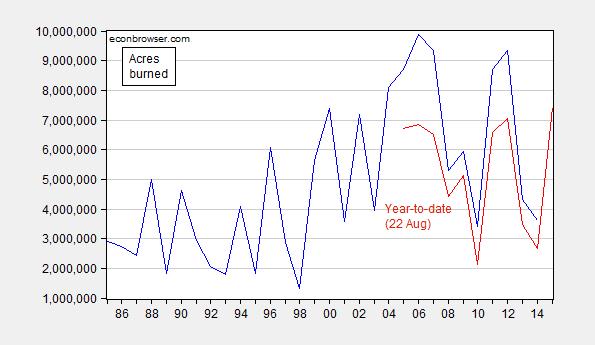
Figure 2: Acres burned (blue) and acres burned ytd (August 22). Source: NIFC1, NFIC2, and author’s calculations.
The high values for 2015 on YTD burn are the highest in 20 years. [1]
One can use the YTD burn to project total burn. I use a log-log specification (R2 = 0.95, DW = 2.07) to produce a forecast for 2015.
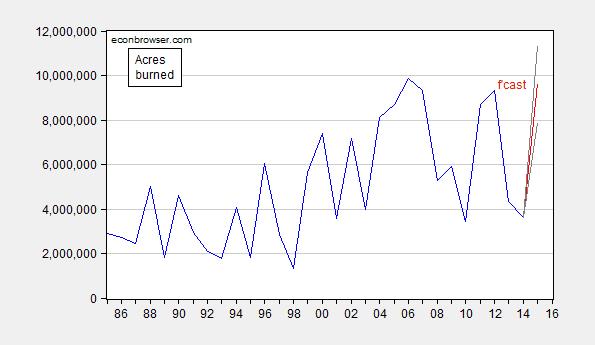
Figure 3: Acres burned (blue) and predicted 2015 based on YTD burn (red). 90% confidence band denoted by gray lines. Source: NIFC1, NFIC2, and author’s calculations.
While the 2015 mean forecast is slightly below the previous peak in 2006, a slight modification (no constant) would yield a mean forecast above the 2006 peak. And using the baseline specification, the 90% interval easily encompasses much higher values.
Finally, I can use the relationship between total firefighting expenditures, projected acres burned and the CPI to infer 2015 expenditures.
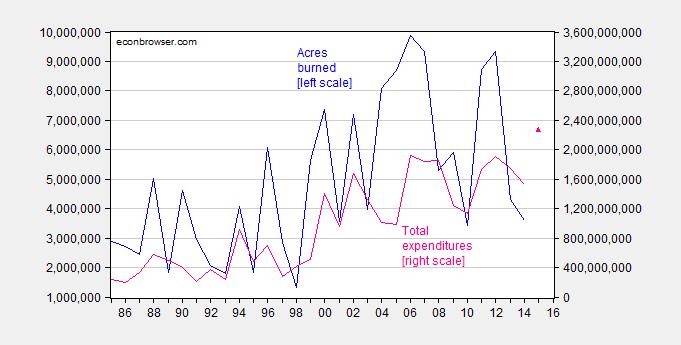
Figure 4: Acres burned (blue, left scale) and total firefighting expenditure in dollars (pink, right scale) predicted 2015 (pink triangle). 90% confidence band denoted by gray lines. Source: NIFC1, NFIC2, and author’s calculations.
My central forecast is for substantially higher expenditures in 2015.


Menzie David Chinn's Blog


