
Kansas: The Macro Outlook
The politics of the The Kansas Experiment were recounted in Sunday’s NYT Magazine. Does the economic crash continue?
Short answer: yes.
The Kansas stall is placed in National context in Figure 1, using the Philadelphia Fed’s coincident indices, normalized so both Kansas and US economic activity are at 0 at 2011M01, when Governor Brownback takes office.
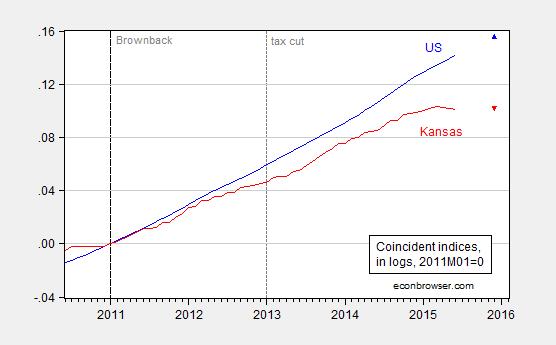
Figure 1: US coincident index (blue) and Kansas (red), both in logs, normalized to 0 in 2011M01. Observations for December 2015 are forecasts implied by leading indices. Dashed lines at Brownback (2011M01), and tax cuts (2013M01). Source: Philadelphia Fed coincident, leading indices, June releases.
The decline shows up regardless of whether employment is measured using the establishment or household surveys.
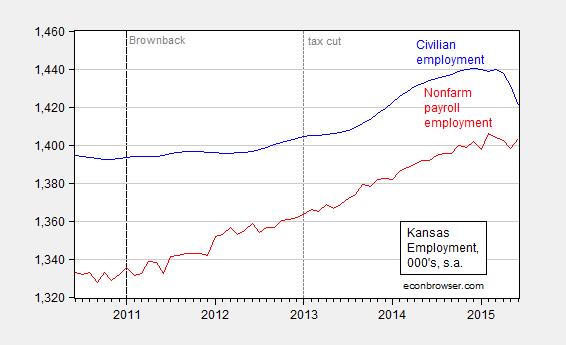
Figure 2: Kansas nonfarm payroll employment (red), and civilian employment (blue), 000’s, s.a. Dashed lines at Brownback (2011M01), and tax cuts (2013M01). Source: BLS.
Some have argued the recent decline is due to drought. Drought does not seem to be an explanation to me.
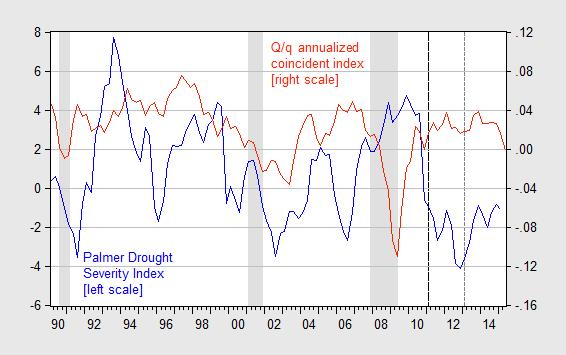
Figure 3: Kansas Palmer Drought Severity Index (blue, left scale), q/q annualized growth in Kansas coincident index (red, right scale). Dashed lines at Brownback (2011M01), and tax cuts (2013M01). Source: Philadelphia Fed coincident, NOAA.
Yet others have asserted that the negative shock to aircraft demand explains the lackluster growth in Kansas. Evidence from employment data is not supportive of this thesis, as shown here.
I would argue much of the downturn especially post January 2013 is self-inflicted, due to the fiscal policies implemented, as described in the NYT Magazine article.


Menzie David Chinn's Blog


