Guest Contribution: “Time to Re-estimate the U.S. Output Gap: Have the Scars from the Crisis Healed?”
Today we are fortunate to present a guest contribution written by Ali Alichi, senior economist at the International Monetary Fund. The views expressed in this blog are solely those of the author and do not necessarily represent the views of the IMF, its management, nor its Executive Board.
Models with deterministic trends, such as the HP filter or the “hybrid” approach of the Congressional Budget Office (CBO) produce unreliable estimates for the potential output. For example, excess capacity built in the run-up to the Global Financial Crisis (GFC) should be treated as cyclical, but deterministic-trend models initially treat it as permanent, leading to an overestimation of potential output and a large output gap in the aftermath of the Crisis. In a recent paper, we have developed a multivariate (MV) filtering methodology, which tackles this issue for the U.S. economy, among other desirable features.
Methodology
The MV filtering methodology extracts the unobservable potential output from observables (output, employment indicators, capacity utilization, inflation indicators, etc). This is done by (i) breaking all variables into structural and cyclical (shock) components, (ii) writing down the economic relationship between variables, e,g,, the Phillips curve, which connects output to inflation, and (iii) estimating the whole system using the data for observables and economic relationships for unobservables. In particular, estimates draw on labor market data, capacity utilization, inflation, and inflation expectations. Not all of this data and economic relationships usually enter traditional estimates, making it hard for them to identify which shocks have longer lasting effects on potential.
Findings
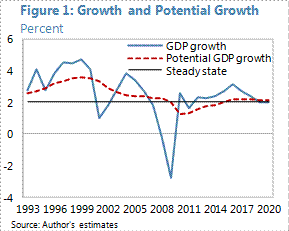
Potential growth has gradually recovered toward 2 percent after the GFC. Figure 1 shows the paths of (real) GDP and potential GDP growth.1 In the second half of 1990s, potential growth reached about 3½ percent, but since early 2000s, it started falling. The GFC brought activity to a halt and potential output growth to the negative territory. Potential growth started to pick up in 2010, and is currently estimated at around its steady state growth rate of about 2.0 percent. Potential growth is expected to surpass its steady state value in the next 2-3 years, as the recovery picks up steam but will slow down to its steady state value of 2.0 percent as demographic effects set in.
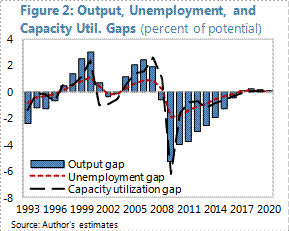
The U.S. output gap has shrunk considerably since the GFC, but is still negative. The U.S. output gap reached about -5¼ percent, following the GFC, but has since been recovering. By end-2014, the output gap stood at around -2.0 percent. It is projected that the output gap would continue shrinking and would be closed in 2017.
Comparing the MV filter results with other estimates
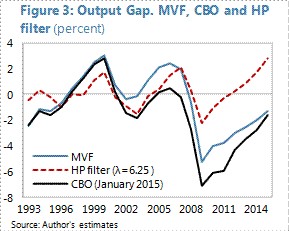
Traditional methods do not capture legacy effects properly. Figure 3 shows a comparison of output gap estimate for the MV filter, CBO, and HP filter. For 2014, the MV filter’s and CBO’s extimates are very close to each other. However, the paths of these two series before are markedly different, with the CBO projecting a noticeably larger output gap after the GFC than the MV filter. This is because the MV filter interprets some of the capacity that was built in the runup to the crisis as a temporary shock. CBO’s methodlogy, howver, initally treats most of the capacity built in the run up to the crisis as permanent, given its deterministic-trend approach. This changes over years as weak data on growth inform CBO’s projections that a sizable part of the capacity built before the ciris was not permanent, brining CBO’s estimate closer to MV filter’s estimate over time, in the absence of additional crisis. Figure 3 also reports the results of an HP filter with the actual growth data up to 2014. In the next section we show that HP filter’s estimates vary significantly as more data is available, making it very unrelibale to estimate the potential output and output gap.
Tackling the end-of-sample problem
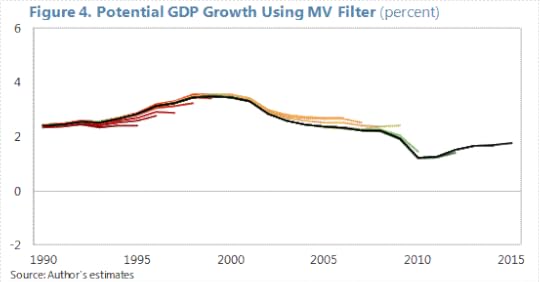
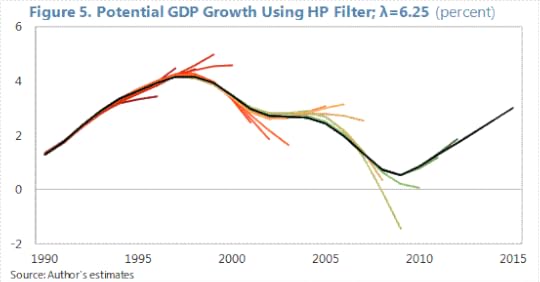
A well known problem with filters, such as the HP, is the end-of-sample problem. As data is added to the end of the sample, projections change significantly. MV filters are also generally subject to this end-of-sample problem. The MV filter resolves this issue by drawing on information from growth and inflation expectations. Figures 3 shows estimates of output gap, using our MV filter, as well as the HP filter. Estimates of potentail output for the MV filter are presented in Figure 4, and for the HP filter are presented in Figure 5. In Figures 4-5, potential output is projected for 5 periods ahead and with each additional year, the sample is extended by one year and potential output is reestimated. Out-of-sample estimates from the MV filter remain much closer to the final (current) estimate, which is shown in black, while for the HP filter, out-of-sample estimates substantially deviate from the final (current) estimate. This is largely because the MV filter uses the information in growth and inflation expectations to inform its projections, but the HP filter does not.
Conclusion
So, have the scars from the GFC healed? Not yet. The output gap is still negative and potential has yet to recover to its new long-term level. But irrespective of what methodology is used, there is a consensus that the output gap is shrinking.
This post written by Ali Alichi.
1. In Figure 1, real GDP growth until 2014 is from actual data from the Bureau of Economic Analysis, but for 2015 and onwards, it is MV filtering model’s projection. Potential GDP growth is model’s estimate\projection for the entire sample.
Menzie David Chinn's Blog


