
Messages from the June State Employment Release
According to today’s release, employment and hours downturns in Wisconsin and Kansas continue. The Wisconsin economic downturn continues along several other dimensions (with the labor force now declining).
Figures 1-4 show private nonfarm payroll employment and aggregate hours for California, Kansas, Minnesota and Wisconsin.
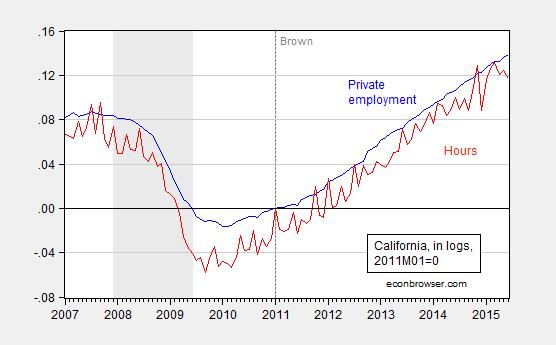
Figure 1: California private nonfarm payroll employment (blue) and aggregate hours (red), seasonally adjusted, in logs, 2011M01=0. NBER recession dates shaded gray. A value of 0.10 means that measure has risen 10% in log terms since 2011M01. Aggregate hours calculated by multiplying employment by average hours, average hours seasonally adjusted by author using ARIMA X-12 executed in EViews. Source: BLS, NBER, and author’s calculations.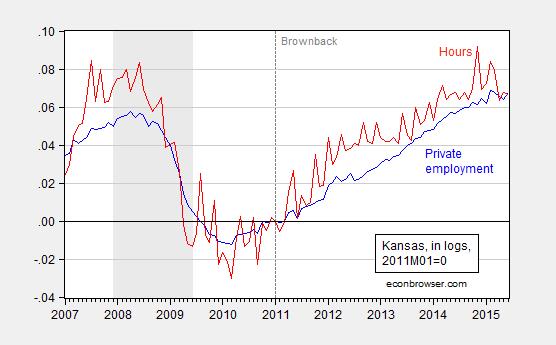
Figure 2: Kansas private nonfarm payroll employment (blue) and aggregate hours (red), seasonally adjusted, in logs, 2011M01=0. NBER recession dates shaded gray. A value of 0.10 means that measure has risen 10% in log terms since 2011M01. Aggregate hours calculated by multiplying employment by average hours, average hours seasonally adjusted by author using ARIMA X-12 executed in EViews. Source: BLS, NBER, and author’s calculations.
[Aside: people who assert without any statistical basis that the significant slowdown in economic activity in Kansas was due to drought should consult this post]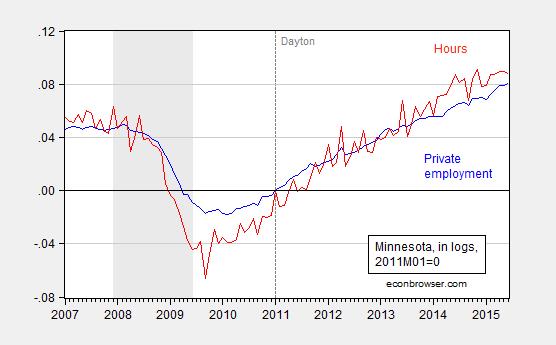
Figure 3: Minnesota private nonfarm payroll employment (blue) and aggregate hours (red), seasonally adjusted, in logs, 2011M01=0. NBER recession dates shaded gray. A value of 0.10 means that measure has risen 10% in log terms since 2011M01. Aggregate hours calculated by multiplying employment by average hours, average hours seasonally adjusted by author using ARIMA X-12 executed in EViews. Source: BLS, NBER, and author’s calculations.
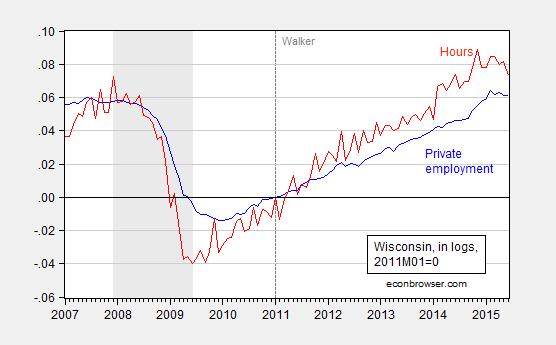
Figure 4: Wisconsin private nonfarm payroll employment (blue) and aggregate hours (red), seasonally adjusted, in logs, 2011M01=0. NBER recession dates shaded gray. A value of 0.10 means that measure has risen 10% in log terms since 2011M01. Aggregate hours calculated by multiplying employment by average hours, average hours seasonally adjusted by author using ARIMA X-12 executed in EViews. Source: BLS, NBER, and author’s calculations.
I estimate aggregate hours as the product of average weekly hours for all private employees and private employment. The hours variable is volatile, even after seasonal adjustment, so I plot a 3 month centered moving average for the four states against the US series in Figure 5.
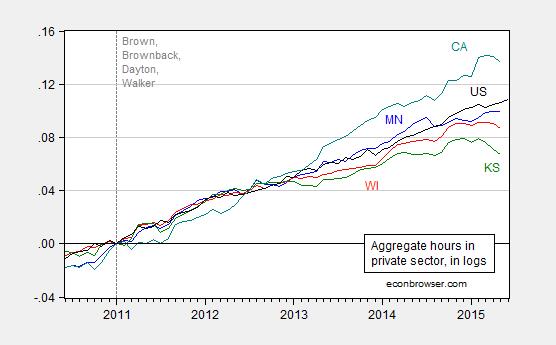
Figure 5: Aggregate hours for Minnesota (blue), Wisconsin (red), Kansas (green), California (teal), and US (black), all 3 month centered moving averages for states, in logs 2011M01=0. A value of 0.10 means that measure has risen 10% in log terms since 2011M01. Source: BLS and author’s calculations.
While Minnesota aggregate hours have flattened, and California has reverted to trend, Wisconsin and Kansas are pretty unambiguously turning downward. For Wisconsin, we know that these establishment data will be drastically revised (likely downward) when the QCEW data are incorporated into the annual benchmark.[1] That takes place early next year. What do we know now?
For Wisconsin we have data from the household survey confirming (1) the establishment series decline in private and overall employment over the last few months, and (2) suggesting a decline in labor force (with the caveat that the state level household survey data are noisy).
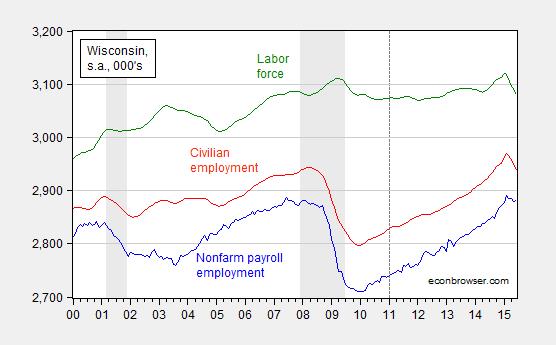
Figure 6: Nonfarm payroll employment (blue), civilian employment (red), and civilian labor force (green), all in 000’s, seasonally adjusted. NBER defined recession dates shaded gray. Source: BLS and NBER.
All these data suggest that there might be some rough times ahead for Kansas and Wisconsin. New coincident indices will come from the Philadelphia Fed on July 24th. (Current release plotted here).
Update, 6:30pm Pacific: In a desperate attempt to explain away the Kansas downturn, Ironman asserts that I have ignored the critically important issue of the downturn in aircraft production. While I do not doubt the negative impact of the decrease of aircraft production, the quantitative magnitude seems to rule this out as the cause of the negative spiral that is Kansas. Figure 7 depicts a decomposition of changes (in 000’s) in private nonfarm payroll employment.
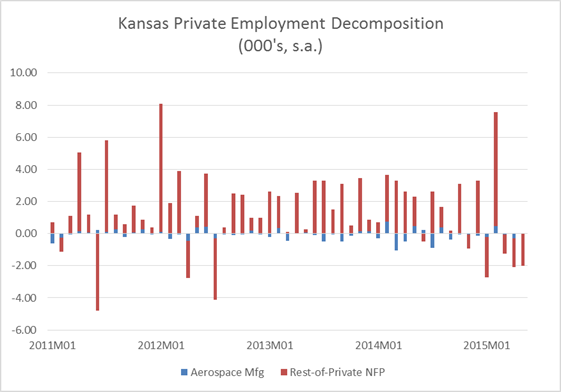
Figure 7: Month-on-month change in aerospace and parts manufacturing (blue), and rest-of-private nonfarm payroll employment (red), in 000’s. Aerospace and parts manufacturing seasonally adjusted (multiplicative) using ARIMA X-12 executed in EViews 9. Source: BLS and author’s calculations.
In addition to the wrong magnitude, the timing is also off for explaining the recent decline in employment. (By the way, real GSP numbers indicate flat durables manufacturing output through end of 2013.)


Menzie David Chinn's Blog


