
Firm-specific factors in rising income inequality
I spent the last two weeks in Boston at the NBER Summer Institute where I learned about a lot of interesting new economic research. Here I describe a new paper by Jae Song, David Price, Fatih Guvenen, Nicholas Bloom, and Till von Wachter on the role of firm-specific factors in rising income inequality.
These researchers constructed from administrative records an amazing matched employer-employee data set covering all U.S. firms and individuals for which W-2 income statements were filed over a 30-year period. The data are summarized in terms of wt(s), which denotes the natural log of the real wage earnings in year t (measured in 2012 dollars) of the person who was in the sth income percentile in year t. For example, the median worker in 1982 received w1982(50) = ln($28,000)= 10.24 (in 2012 dollars), while the median worker in 2012 received w2012(50) = ln($33,600) = 10.42. The log difference is 10.42 – 10.24 = 0.18 implying a percent change of approximately 18%. Although the median worker in 1982 was of course not the same individual as the median worker in 2012, one way that rising inequality is often represented is with a plot of w2012(s) – w1982(s) as a function of s as is done in the blue line in the graph below. As just noted, the height of this line is 0.18 at s = 50, but it is much higher than this for people above the 95th percentile. Someone in the 95th percentile today is earning much more than a person who was in the 95th percentile in 1982, whereas someone in the 5th percentile is only earning a little more than their counterpart in 1982. The upward slope in the blue line as s increases, particularly for high values of s, is one indicator people sometimes look at to measure rising inequality.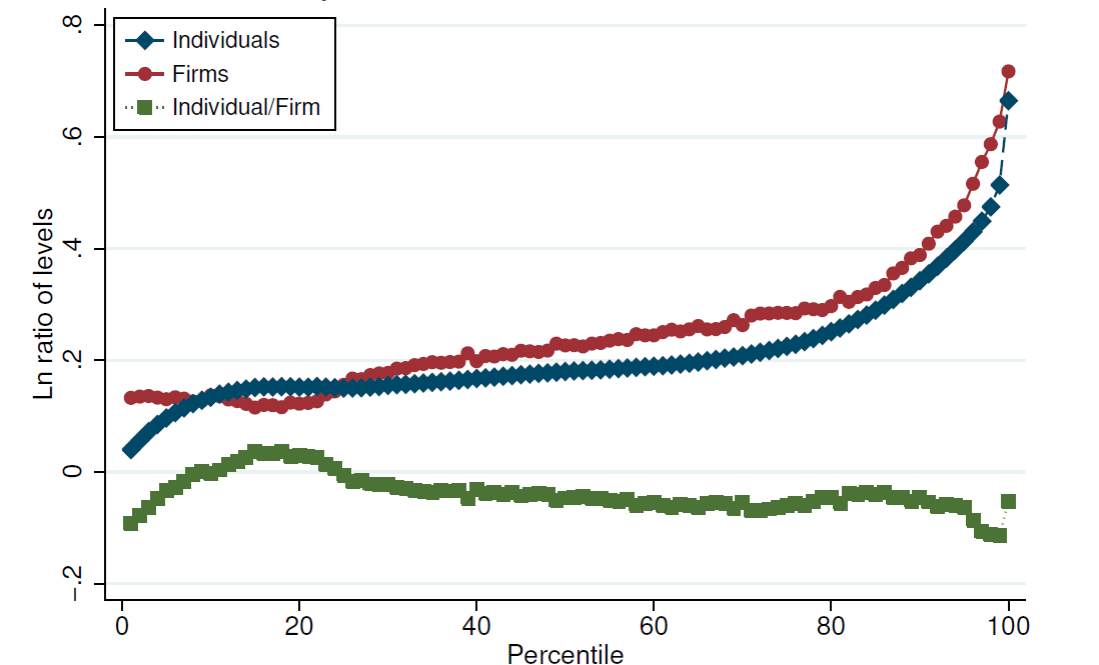
Blue: log change in real wages (vertical axis) of percentile s (horizontal axis) between 1982 and 2012. Green: change attributable to differences between the wage of the individual and the average wage of people working for the same employer as that individual. Red: change attributable to differences between the wages paid by different employers. Source: Song, Price, Guvenen, Bloom and von Wachter (2015).
The authors then looked at how much of this change could be attributed to differences in earnings across people who all work for the same employer. They calculated the difference between wt(s) and the average log earnings of other people who worked for the same employer as did the individual who was in the sth percentile, and examined how those differences changed between 1982 and 2012. This number is represented by the height of the green line in the graph above. It actually slopes down over most of the range. There is a modest contribution to rising inequality of within-firm differences in pay at the very lowest and very highest percentiles, but for the most part differences in pay across individuals working for the same firm have very little to do with rising inequality.
Yet another calculation we could make is look at the average wage of all the people who worked at the same firm in 1982 as did the individual who was in the sth percentile in 1982, and compare that with the average wage of all the people who worked at the same firm as did the individual who was in the sth percentile in 2012. This is plotted as the red line in the graph above. Note that the sum of the heights of the red and green lines equals the height of the blue line for every s by definition. The red line seems to be the whole story. The key question is not whether you’re one of the higher paid people within the establishment for which you’re currently working. The question is instead whether you’re fortunate to be working for one of the establishments that is paying a wage to its average worker that is higher than the average wage at other firms.
The authors conclude:
Contrary to the assertions made by Mishel and Sabadish (2014), Piketty (2013), and others, we find strong evidence that within-firm pay inequality has remained mostly flat over the past three decades…. on average, individuals’ inequality with their coworkers has changed little over the past three decades.


Menzie David Chinn's Blog


