
Greece: Is Internal Devaluation Enough?
Even if Greek Prime Minister Tsipras is able to maneuver the new agreement through the parliament [0], it’s not clear to me that — even with the aid and reprofiling of debt — Greece will resume growth (see discussion O’Brien/Wonkblog). That’s true even though there has been noticeable adjustment in production costs in Greece.
First, consider unit labor costs in some key euro area countries.
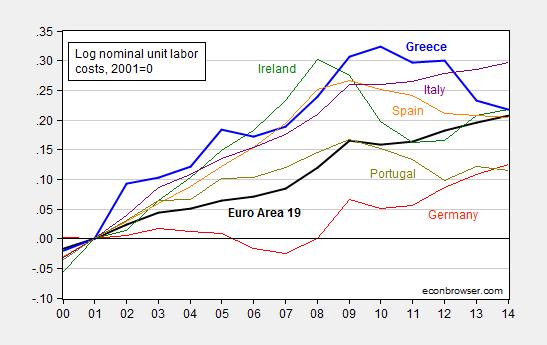
Figure 1: Log nominal unit labor costs (ULC) per hour for euro area 19 (black), Greece (blue), Germany (red), Ireland (green), Spain (orange), Portugal (chartreuse), and Italy (purple), all normalized 2001=0. Source: Eurostat, and author’s calculations.
Greek nominal unit labor costs have declined 10.8% since the peak in 2010 (in log terms). That works out to 2.7% per year increase in competitiveness. Ireland, the canonical example of the flexible adjuster, managed faster adjustment — 13.9% in 3 years, or 4.6% per year.
Since the ULCs are indices, it’s not really possible to make a direct comparison of costs of production. (See Daniel Gros/CEPS for an argument why 1999 is not the right year to normalize on; I normalize on 2001, before North/South Eurozone current account imbalances exploded.) All we know from Figure 1 is that the disadvantage between Greek unit labor costs and German has decreased. (Artus, Gravet/Natxis indicate approximately 12% Greek absolute cost disadvantage relative to Germany in 2013).
So, second, consider one interesting point — despite the comparable adjustments, output has fallen far more in Greece than in Ireland.
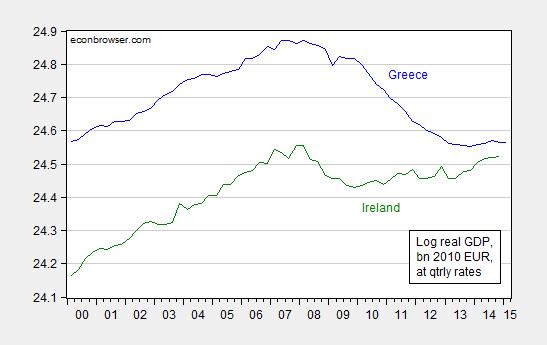
Figure 2: Log real GDP for Greece (blue) and for Ireland (green), in billions 2010 prices, quarterly rates. Source: OECD Main Economic Indicators via FRED, and author’s calculations.
Greek real GDP has fallen 31% (log terms) from peak to 2015Q1. Irish GDP fell 13% peak to trough, and as of 2014Q4 only 4% below peak.
How to reconcile the comparable, large decrease in unit labor costs, and the differing paths in output? There are many factors, but I think one key point to keep in mind is that the unit labor cost (or price level) decline is a function of both the slopes of the aggregate demand and aggregate supply curves and the distance from full employment output. Recall this graph (from Blanchard and Johnston) depicting internal adjustment.

Figure 3: Adjustment toward full employment output from negative output gap, in a currency union. Source: Blanchard and Johnston, Macroeconomics.
The graph highlights that a given drop in prices (or unit labor costs) can occur with a flat AS curve with large (negative) output gap, or steep AS curve and small (negative) output gap. In other words just because the price level is falling (or unit labor costs), it doesn’t mean that one is approaching full employment. And in fact, in May, the IMF forecast the 2014 output gap for Greece at -9.3% of potential GDP. The corresponding figure for Ireland was -2.9% (see Krugman for a discussion of costs of adjustment.) In other words, demand deficiency is key to understanding the perversity of the program now being considered. It’s a sort of corollary of the point Charles Wyposz made about the origins of the eurozone crisis, It’s About Demand, not Competitiveness.
These points are consistent with Ashok Mody’s three lessons from IMF research
Update, 11am Pacific: Charles Wyplosz concurs; we’ll be back at negotiations soon, even if this deal is approved by the Greek parliament.


Menzie David Chinn's Blog


