
Ongoing Developments in China
While eyes are on developments in Greece (and rightly so), I thought it would be useful to spend a moment on the uncertainty regarding the Chinese economy’s course (not that I’m the first to point out).
The wild gyrations in the Chinese stock market are displayed in Figure 1; the stock market has doubled over the past year.
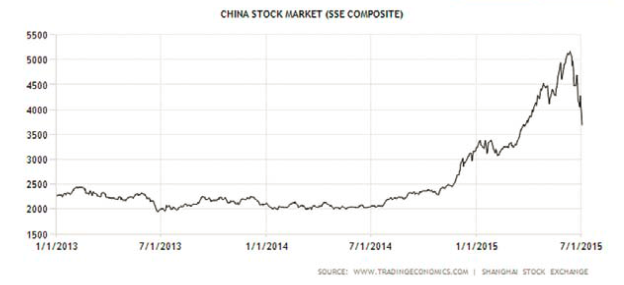
Figure 1: Shanghai Stock Exchange. Source: Tradingeconomics.com
The plunge has spurred a flurry of large interventions by the government, with the government coordinating a fund to buy blue chip stocks, a halt to IPOs, and the move for the PBOC and one arm of the country’s sovereign wealth fund to backstop the stock market by lending to brokerage firms (see Bradsher, Buckley/NYT). This activity follows a series of measures implemented over the past few months.
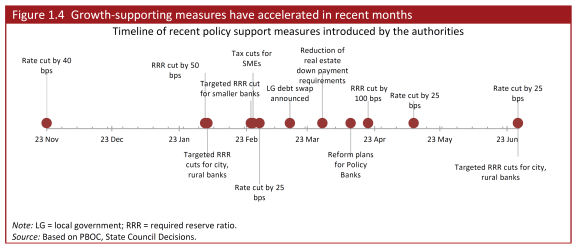
Source: World Bank, China Economic Outlook June 2015 (July 3 update).
The anxiety over the stock market is heightened by the fact that output growth, measured in various ways, is decelerating. A shock to household wealth will surely put a damper on consumption; and a hit to confidence in the government’s economic management cannot help either.
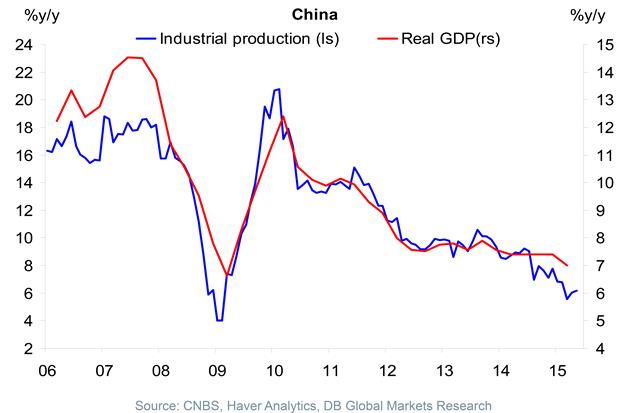
Figure 2: Output measures for China. Source: Torsten Slok/Deutsche Bank (July 2015) [not online].
Some additional current statistics are reported in the World Bank, China Economic Outlook June 2015 (July 3 update). (The current version omits a section on longer term issues regarding the financial system; see here).
Finally, some context. Figure 3 presents the dollar increments to world GDP (in PPP terms, i.e., billions of current international dollars) for 2011-2016. Figure 4 presents the same, except expressed in contributions to world GDP growth.
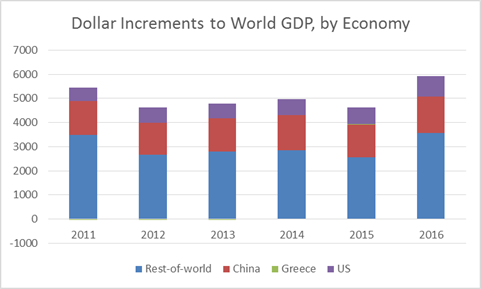
Figure 3: Dollar contributions to world GDP increase, in billions of current international dollars, from US (blue), China (red), Greece (green) and Rest-of-world (purple). 2015 and 2016 observations are IMF estimates from May. Source: IMF, World Economic Outlook May 2015 database, and author’s calculations.
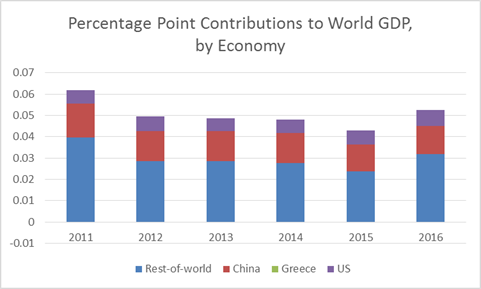
Figure 4: Percentage point contributions to world GDP growth in PPP terms, in decimal form, from US (blue), China (red), Greece (green) and Rest-of-world (purple). 2015 and 2016 observations are IMF estimates from May. Source: IMF, World Economic Outlook May 2015 database, and author’s calculations.
Greece does not show up in either graph; of course, that doesn’t foreclose the possibility that the outcome of the Greek crisis will have outsized financial repercussions.
Latest reports on the Chinese markets as of 9pm Pacific, [1]


Menzie David Chinn's Blog


