
Ten years of Econbrowser
Last week marked the tenth anniversary of Econbrowser. That gives me an occasion to talk a little about why I started the blog and what we’ve accomplished with it.
One of my goals was to bring a real-time dimension to academic research. Ten years ago I had just finished a research paper with U.C. Riverside Professor Marcelle Chauvet. We were suggesting a simple pattern-recognition algorithm for dating economic recessions that we thought would work with real-time data. One of the challenges to people making practical business or policy decisions is that the data keep getting revised. Many economists work with the numbers as they’re currently reported when they look for patterns in the data. But for our project we used an approach that was at the time a little unusual, assembling the different data sets as they had actually been reported at each separate quarter and month in history and seeing what the inference of our algorithm would have been at each date, something that’s very easy for anybody today to do using tools like ALFRED. This approach, which I might call “simulated real-time analysis,” suggested that our methods held promise. But it is one thing to look today at historical “real-time” data and say, “here is what I could have concluded at the time.” It is another thing to actually make the calls in real time. That’s one of the things we have been doing at Econbrowser.
The graph below is one example of that. It plots the Recession Indicator Index that we initiated ten years ago. Everything to the left of the vertical line is “simulated real-time analysis,” that is, what the algorithm would have concluded given only data as it had been reported at the time but with the analysis all conducted in 2005. The data the right of the line is what I would call “actual real-time analysis;” every one of those data points was published here at Econbrowser one quarter after the indicated date over a ten-year period.
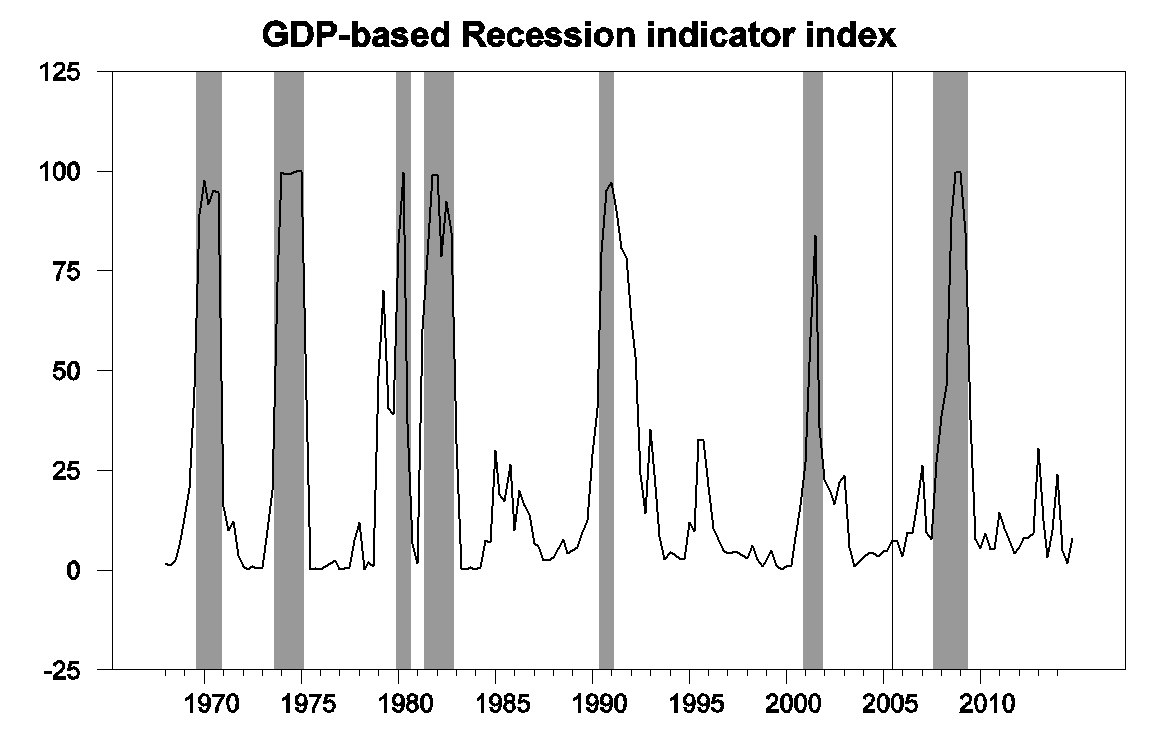
GDP-based recession indicator index. Values to the right of the vertical line have each been publicly reported exactly one quarter after the indicated date, with 2014:Q4 the last date shown on the graph. Shaded regions represent the NBER’s dates for recessions, which dates were not used in any way in constructing the index, and which were sometimes not reported until two years after the date.
Another one of my goals for the blog was to open better dialog between academic economists, policy makers, and people outside of economics. I was very concerned– and remain so today– about how insular some of my academic colleagues can let themselves become, writing just for other economists using assumptions and conventions shared by other economists. I think it is a very healthy exercise to try to explain from scratch why we think what we do in a way that an intelligent person, who did not share any of the preconceptions or prejudices of academic economists, could follow and evaluate. Such an exercise can often uncover blind spots that the traditional academic protocol can miss. I was fortunate that Menzie Chinn had an interest in joining me in this effort almost from the very beginning, adding his expertise in international and other areas of economics and a passion for covering policy issues.
The blog in this way functions as a personal journal for me, as I try to make sense of what I see and learn from watching the real world unfold, sometimes contrary to my anticipations. Over the last decade we followed the financial strains associated with the housing bubble as they built, snapped, and continue to reverberate today. At the beginning I was definitely underestimating the full implications of what was going on. The biggest reason I was wrong about the bubble early on was a question about incentives– why would financial institutions and investors put hundreds of billions of dollars at risk with fundamentally unsound loans, I asked? Today I think the answer is a combination of misaligned incentives— the actors were often gambling with other people’s money– and a form of groupthink— it’s very hard to be the only person in your institution arguing that the profits everybody is making at the moment are going to come back to bite them very hard.
Another topic I changed my mind about was world oil supplies. I began as a skeptic about peak oil. My views evolved as I watched conventional oil production stagnate over the last decade. But I was surprised also at the success of the unconventional production from U.S. shale oil. It’s a little amusing that one of my posts from 2005 as well as 2015 were on the same topic, namely, what in the world is oil doing at $55/barrel? Though the first was asking why the price was so high, and the second why it was so low.
And it will be interesting to see which force will win out over the decade to come, as well as to gauge the ultimate success of unconventional monetary policy, and see what holds for the future of the U.S., European, and world economies. I’ll be sharing my thoughts on these issues, and listening to yours, right here at Econbowser.


Menzie David Chinn's Blog


