
A Parsimonious Error Correction Model of Kansas Economic Activity
Or “Kansas macro crash…and burn”
Patrick Marvin argues that Kansas is doing fine, and the tax cuts just need a bit more time to kick in to spur the economy. My reading of the data and estimates suggest otherwise.
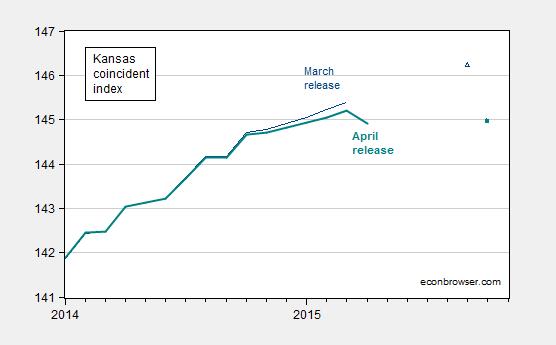
Figure 1: Coincident index for Kansas, March release (dark blue), April release (bold teal). Dark blue triangle (solid teal box) denote corresponding forecasts from March and April releases of leading indices. Source: Philadelphia Fed (coincident), Philadelphia Fed (leading), and author’s calculations.
There has been some debate regarding the pace of economic growth in Kansas over the past four years. In order to compare the outcome with what might be expected, I construct a counterfactual, based upon the historical correlation of Kansas economic activity with US economic activity over the 1979-2015 period. I use as a proxy for economic activity the Philadelphia Fed’s coincident indices, which apply the Stock-Watson approach to extracting a state factor from multiple time series (of possibly differing frequencies).
The log of the coincident series for Kansas and the US do not reject the I(1) null at conventional levels. At the same time, they appear to be cointegrated according to standard test (Johansen, constant, no trend, 3 lags of first differences, at 10% msl).
Hence, I estimate a single-equation error correction model, assuming US economic activity is weakly exogenous for Kansas, over the 1986M01-2010M12. Let ks be the log coincident index for Kansas, and us be the log coincident index for the US. Δ is the first difference operator. The resulting estimates are:
Δwit = –0.001 – 0.0047kst-1 + 0.0049ust-1 + first and second lags of first differences
Adj-R2=0.74, SER = 0.0017, N = 380. Significance at 10% msl denoted by bold face.
Observation 1: This is a pretty high coefficient of variation. Statistically, the m/m growth rate in Kansas economic activity is well explained.
Observation 2: The cointegrating relationship between Kansas output and US is about 1.03.
Observation 3: Estimating the equation over the entire 1990M01-2015M03 does not yield similar coefficients.
I use the equation estimated over 1979-2010 to dynamically forecast out of sample over the 2011M01-2015M03 period, taking as given the ex post realization of the US coincident index. (Technically this is a ex post historical simulation.)
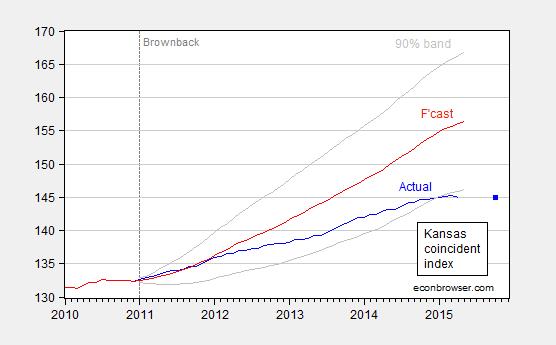
Figure 2: Coincident index for Kansas (blue), ECM forecast (red), and 90% confidence band (gray). Observation for October (blue square) is implied by April leading index. For forecast, see text. Source: Philadelphia Fed (April releases) and author’s calculations.
This outcome suggests that Kansas has been underperforming since 2012M01 relative to a counterfactual based on historical correlations in place over the 1979-2010 period. As of April 2015, actual activity is 7.4% (log terms) below what it should be.


Menzie David Chinn's Blog


