
More GPS Cycling Tests: Things are Pretty Bad and There’s Little Hope
Note: this article may not appear properly in news readers.
This article contains interactive aspects that are likely removed by most news readers. Please see this particular article directly on Jeffrey's blog for full functionality.
Nikon D700 + Sigma “Bigma” 50-500mm OS @ 50mm — 1/1250 sec, f/8, ISO 560 —
map & image data — nearby photos
Top of Mt. Otowa (音羽山)
Kyoto, Japan
I made my second cycling run up Mt. Otowa (音羽山) on Wednesday, the first having been two
days prior in the gloomy late afternoon just before a typhoon came through.
Wednesday's was the first afternoon after the mild typhoon passed, so I
expected the air to be really clear (like this and this), so I lugged my Sigma “Bigma” 50mm~500mm
zoom all the way up there, along with the 2×TC to give me a 1,000mm lens.
It was so not worth it... it was the most hazy I'd seen it in ages.
Nikon D700 + Sigma “Bigma” 50-500mm OS @ 100mm — 1/1250 sec, f/13, ISO 800 —
map & image data — nearby photos
Super Super Hazy
I was there for an hour, and could never even find Kyoto Tower
The only things that were sort of clearly visible were close, just near the foot of the mountain.
This is a gas station that I pass by along the way that marks an increase in the steepness of the route...
Nikon D700 + Sigma “Bigma” 50-500mm OS @ 1000mm — 1/1250 sec, f/13, ISO 1800 —
map & image data — nearby photos
Starts to Get Steeper Soon
As the crow flies it's about 2,580m (1.6mi) away, but due to how the road winds up the mountain,
the covered distance is about three times that. It took me about 49 minutes to make it from there,
and about 23 minutes to make it back down.
(If find it shocking that the return trip takes only half the time; it feels like it takes about 1/10th the time.)
In the spirit of “The Voodoo of Elevation Gain
and Strava (and How I Get Around It)”, I brought three GPS/GLONASS
units with me, using various ways to extract nine different tracklogs...
DeviceTracklogs
Apple iPhone 6+
Via the Strava app.
Via Abvio's Runmeter app.
Via the Runtastic app.
Via the Galileo Offline Maps app.
Garmin eTrex 20downloaded from the device
Bad Elf GPS Pro +
Downloaded via their app, with GPS elevation.
Downloaded via USB, with GPS elevation.
Downloaded via their app, with barometric elevation.
Downloaded via USB, with barometric elevation.
Now in theory, all four iPhone apps should produce the same tracklog because they all share the same
iOS Location Services data, but they're all quite different. Runmeter (which is identical to their
Cyclemeter and Walkmeter apps except for the name and icon) has an option to use the iPhone's
barometric altimeter, and as the Voodoo post explains, the Strava app ignores both iPhone altimeters,
but elevation aside, the latitude/longitude tracks among the four should be identical, but they're far from it:
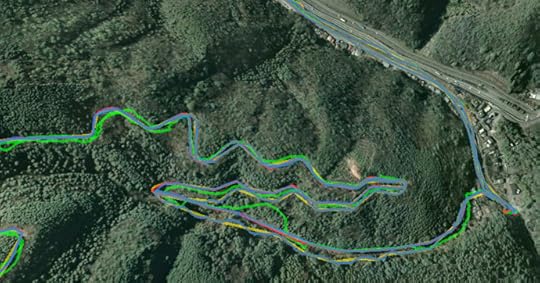
The Four “Identical” iPhone-app Tracks
Part (all?) of the problem is the sampling frequency. Of the four iPhone apps, the most frequent logger is
Galileo Offline Maps, which creates a
datapoint every second when there's obvious movement. The other three apps sample the location “every so often” in
ways that can lead to some big errors. For example, Runmeter's didn't put a
datapoint for where I stopped my ride until more than 30 seconds after I
had stopped, making it look as if I was 30+ seconds slower than I
actually was. Adding 30+ seconds to a segment can destroy the effort (e.g.
a hill-sprint that takes a respectable 90 seconds gets recorded as a pathetic two minutes.)
Even more odd are the four tracklogs from the Bad Elf GPS Pro+. On the plus side, it records a
data point once every second (and can be configured to record 10 per
second!), and also, it records altitude two ways (satellite and
barometric). Because of that last feature, in extracting its data, I'd expect
one track with two elevation profiles, but as odd as it
seems, one can actually derive two different tracks with four
elevation profiles. You see, tracklogs can be pulled from the device via
direct USB connection, or via its iOS app. One
would think that either method is just transporting the same data,
but they inexplicably give different data. I then
split each into two tracklogs, one with the satellite altitude, and
one with the barometric altitude. So we end up
with two tracks with four different elevation profiles. Bizarre.
(I so wanted to like this unit, mostly because the company seemed to have a clue and
wasn't Garmin, but with so many little problems like this cropping up, I have to finally admit
that I can't recommend the unit. )
)
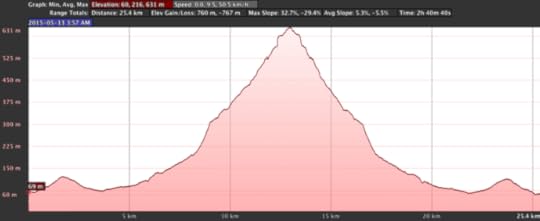
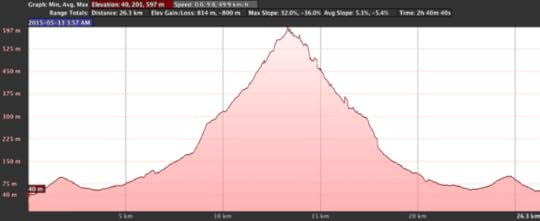
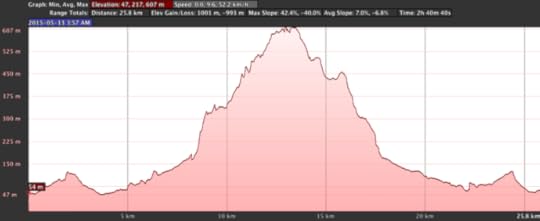
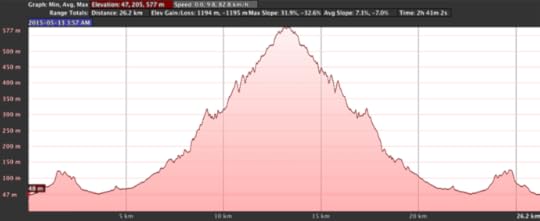
Anyway, I have nine tracklogs, and of course none of them agree on the
amount of vertical gain. This problem likely stems from the aforementioned
sampling frequency, and also the data source (barometric or satellite
altimeter) and post processing. Here's a look at the tracklogs, their
resulting plot in Google Earth, and various claims about the vertical
climb: what the app itself claimed, what my software calculates, and what
Google Earth calculates...


table#t185 td { border-bottom: solid 1px #888; padding: 2px 1em 2px 1em }
table#t185 td:nth-child(2) { text-align: right }
table#t185 td:nth-child(3) { text-align: right }
table#t185 td:nth-child(4) { text-align: right }
table#t185 td:nth-child(5) { text-align: right }
Vertical Gain (meters)
Tracklog
Points
App
Jeff
Earth
iPhone / Galileo
5,243
738
814
iPhone / Strava
3,979
984
1087
1194
iPhone / Runmeter
658
607
582
635
iPhone / Runtastic
2,242
879
863
932
Bad Elf (app/GPS)
9,641
782
855
Bad Elf (app/baro)
9,641
620
752
Bad Elf (USB/GPS)
9,641
782
823
Bad Elf (USB/baro)
9,641
623
760
Garmin eTrex 20
9635
931
1001
The wide variation among results is pretty ridiculous, which is probably an
accurate reflection on the state of consumer GPS, and perhaps why Strava
throws away your elevation data in preference for its data. Sure, Strava's data may
be wildly incorrect, but at least it's consistently incorrect (well,
it has consistency to the extent that a user's two-dimensional location data
— latitude and longitude of each point along the route — is
correct, which is to say that it's not really consistent at all. )
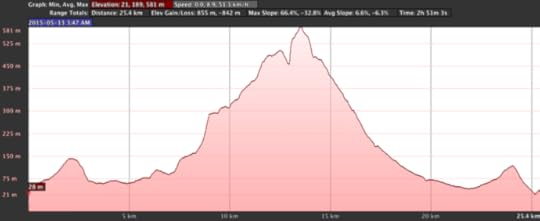
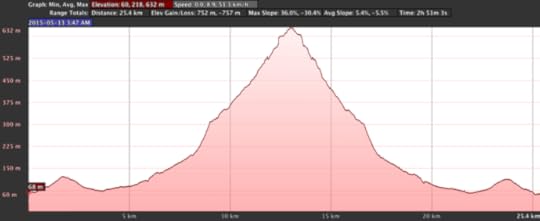
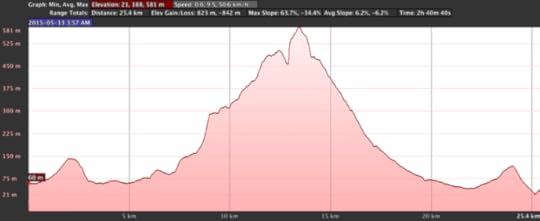
For what it's worth, the shape of the “iPhone / Galileo” elevation
profile looks the most realistic, followed closely by Runmeter and the Bad
Elf barometric. The Runtastic and Strava results are just ridiculous, and
the GPS tracks from the Bad Elf and Garmin units are clearly broken.
It's a sad state of affairs. I'd love to try the test with one of those
$10,000 commercial/professional unit.
So what's the actual vertical climb for this route?
I'm going to say it's 700m (2,300').
The government of Japan makes very accurate laser-derived elevation data
available on this web site. The route from my house up to the top of the mountain can be broken into just a few
up/down segments, whose vertical climb can be easily derived by comparing
the elevation at the start and end:
li.ed { color: #8D8 }
li.eu { color: #D88 }
Front door to Sanjo St: down 2m
To top of Keage hill: up 51.8m
To low spot just before turnoff to old Sanjo: down 46.5m
To the gas station seen above: up 35.9m
Underpass below Rt 1: down 4.8m
To high point at trail entrance at end of road: up 423m
Tiny/steep downslope near start of trail: down 7m
To top of mountain: up 110.5
The “ups” are the vertical climb on the way there, and the “downs”
become climbs on the way back, so just adding them all together gives the
total: 681.5m
This is an absolute lower bound... the vertical climb will be more if there were
rising slopes that I forgot about.
I do know that there were a few spots on the steep road up the mountain
where it leveled off for a while, and even went
slightly downhill for some time (short reprieves certainly appreciated).
I couldn't measure these well on the web site
because I didn't remember their exact locations,
but let's say there were four of them and the elevation loss was just 2m
each, then that adds 8m (4×2m) that we have to re-climb on the way
up, and the same for the way down, so that leaves us with a calculated 697.5m. It's
probably a bit more than that due to
fluctuations on what seem flat sections, so let's round it up to 700m and
call it a day.
In the end, I uploaded a smoothed version of the Galileo track to Strava,
where it appears as
“Otowayama #2 (音羽山その二)”
with a vertical climb pulled out of thin air as 771m.


Jeffrey E.F. Friedl's Blog
- Jeffrey E.F. Friedl's profile
- 13 followers

