
A Parsimonious Error Correction Model of Wisconsin Economic Activity
With implications for assessing Wisconsin post-January 2011.
There has been some debate regarding the pace of economic growth in Wisconsin over the past four years. In order to compare the outcome with what might be expected, I construct a counterfactual, based upon the historical correlation of Wisconsin economic activity with US economic activity over the 1990-2015 period. I use as a proxy for economic activity the Philadelphia Fed’s coincident indices, which apply the Stock-Watson approach to extracting a state factor from multiple time series (of possibly differing frequencies).
The log of the coincident series for Wisconsin and the US do not reject the I(1) null at conventional levels. At the same time, they appear to be cointegrated according to standard test (Johansen, constant, no trend, 2 lags of first differences, at 5% msl).
Hence, I estimate a single-equation error correction model, assuming US economic activity is weakly exogenous for Wisconsin, over the 1986M01-2010M12. Let wi be the log coincident index for Wisconsin, and us be the log coincident index for the US. Δ is the first difference operator. The resulting estimates are:
Δwit = 0.008 – 0.0064wit-1 + 0.0047ust-1 + first and second lags of first differences
Adj-R2=0.92, SER = 0.00076, N = 252. Significance at 5% msl denoted by bold face.
Observation 1: This is a pretty high coefficient of variation. Statistically, the m/m growth rate in Wisconsin economic activity is well explained.
Observation 2: The cointegrating relationship between Wisconsin output and US is about 0.62.
Observation 3: Estimating the equation over the entire 1990M01-2015M03 yields similar coefficients with statistical significance. A Chow test at 2011M01 rejects the constant coefficients null.
I use the equation estimated over 1990-2010 to dynamically forecast out of sample over the 2011M01-2015M03 period, taking as given the ex post realization of the US coincident index. (Technically this is a ex post historical simulation.)
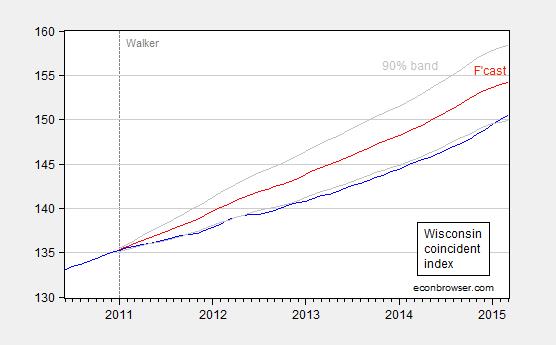
Figure 1: Coincident index for Wisconsin (blue), forecast (red), and 90% confidence band (gray). For forecast, see text. Source: Philadelphia Fed and author’s calculations.
This outcome suggests that Wisconsin has been underperforming since 2011M01 relative to a counterfactual based on historical correlations in place over the 1990-2010 period. As of March 2015, actual activity is 2.4% (log terms) below what it should be.
I would be somewhat wary of putting too much weight on the surge in activity registered in the last few months which puts the actual within the 90% band. That’s because the last six months of data do not incorporate directly the Quarterly Census of Employment and Wages (QCEW) data that the Walker Administration has touted as very precise.
The specification is very simple. One thing it omits is the differential impact arising from shocks, such as the dollar’s movements. Given the relatively heavy share of manufacturing, one would think Wisconsin should have disproportionately benefitted from the weak dollar until about six months ago. And yet, Wisconsin has been underperforming for most of the past four years, according to my estimates.


Menzie David Chinn's Blog


