
The Voodoo of Elevation Gain and Strava (and How I Get Around It)
Note: this article may not appear properly in news readers.
This article contains interactive aspects that are likely removed by most news readers. Please see this particular article directly on Jeffrey's blog for full functionality.
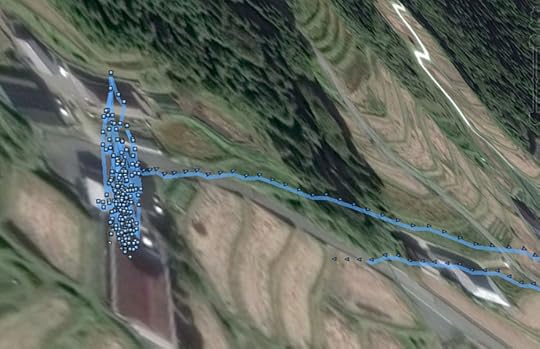
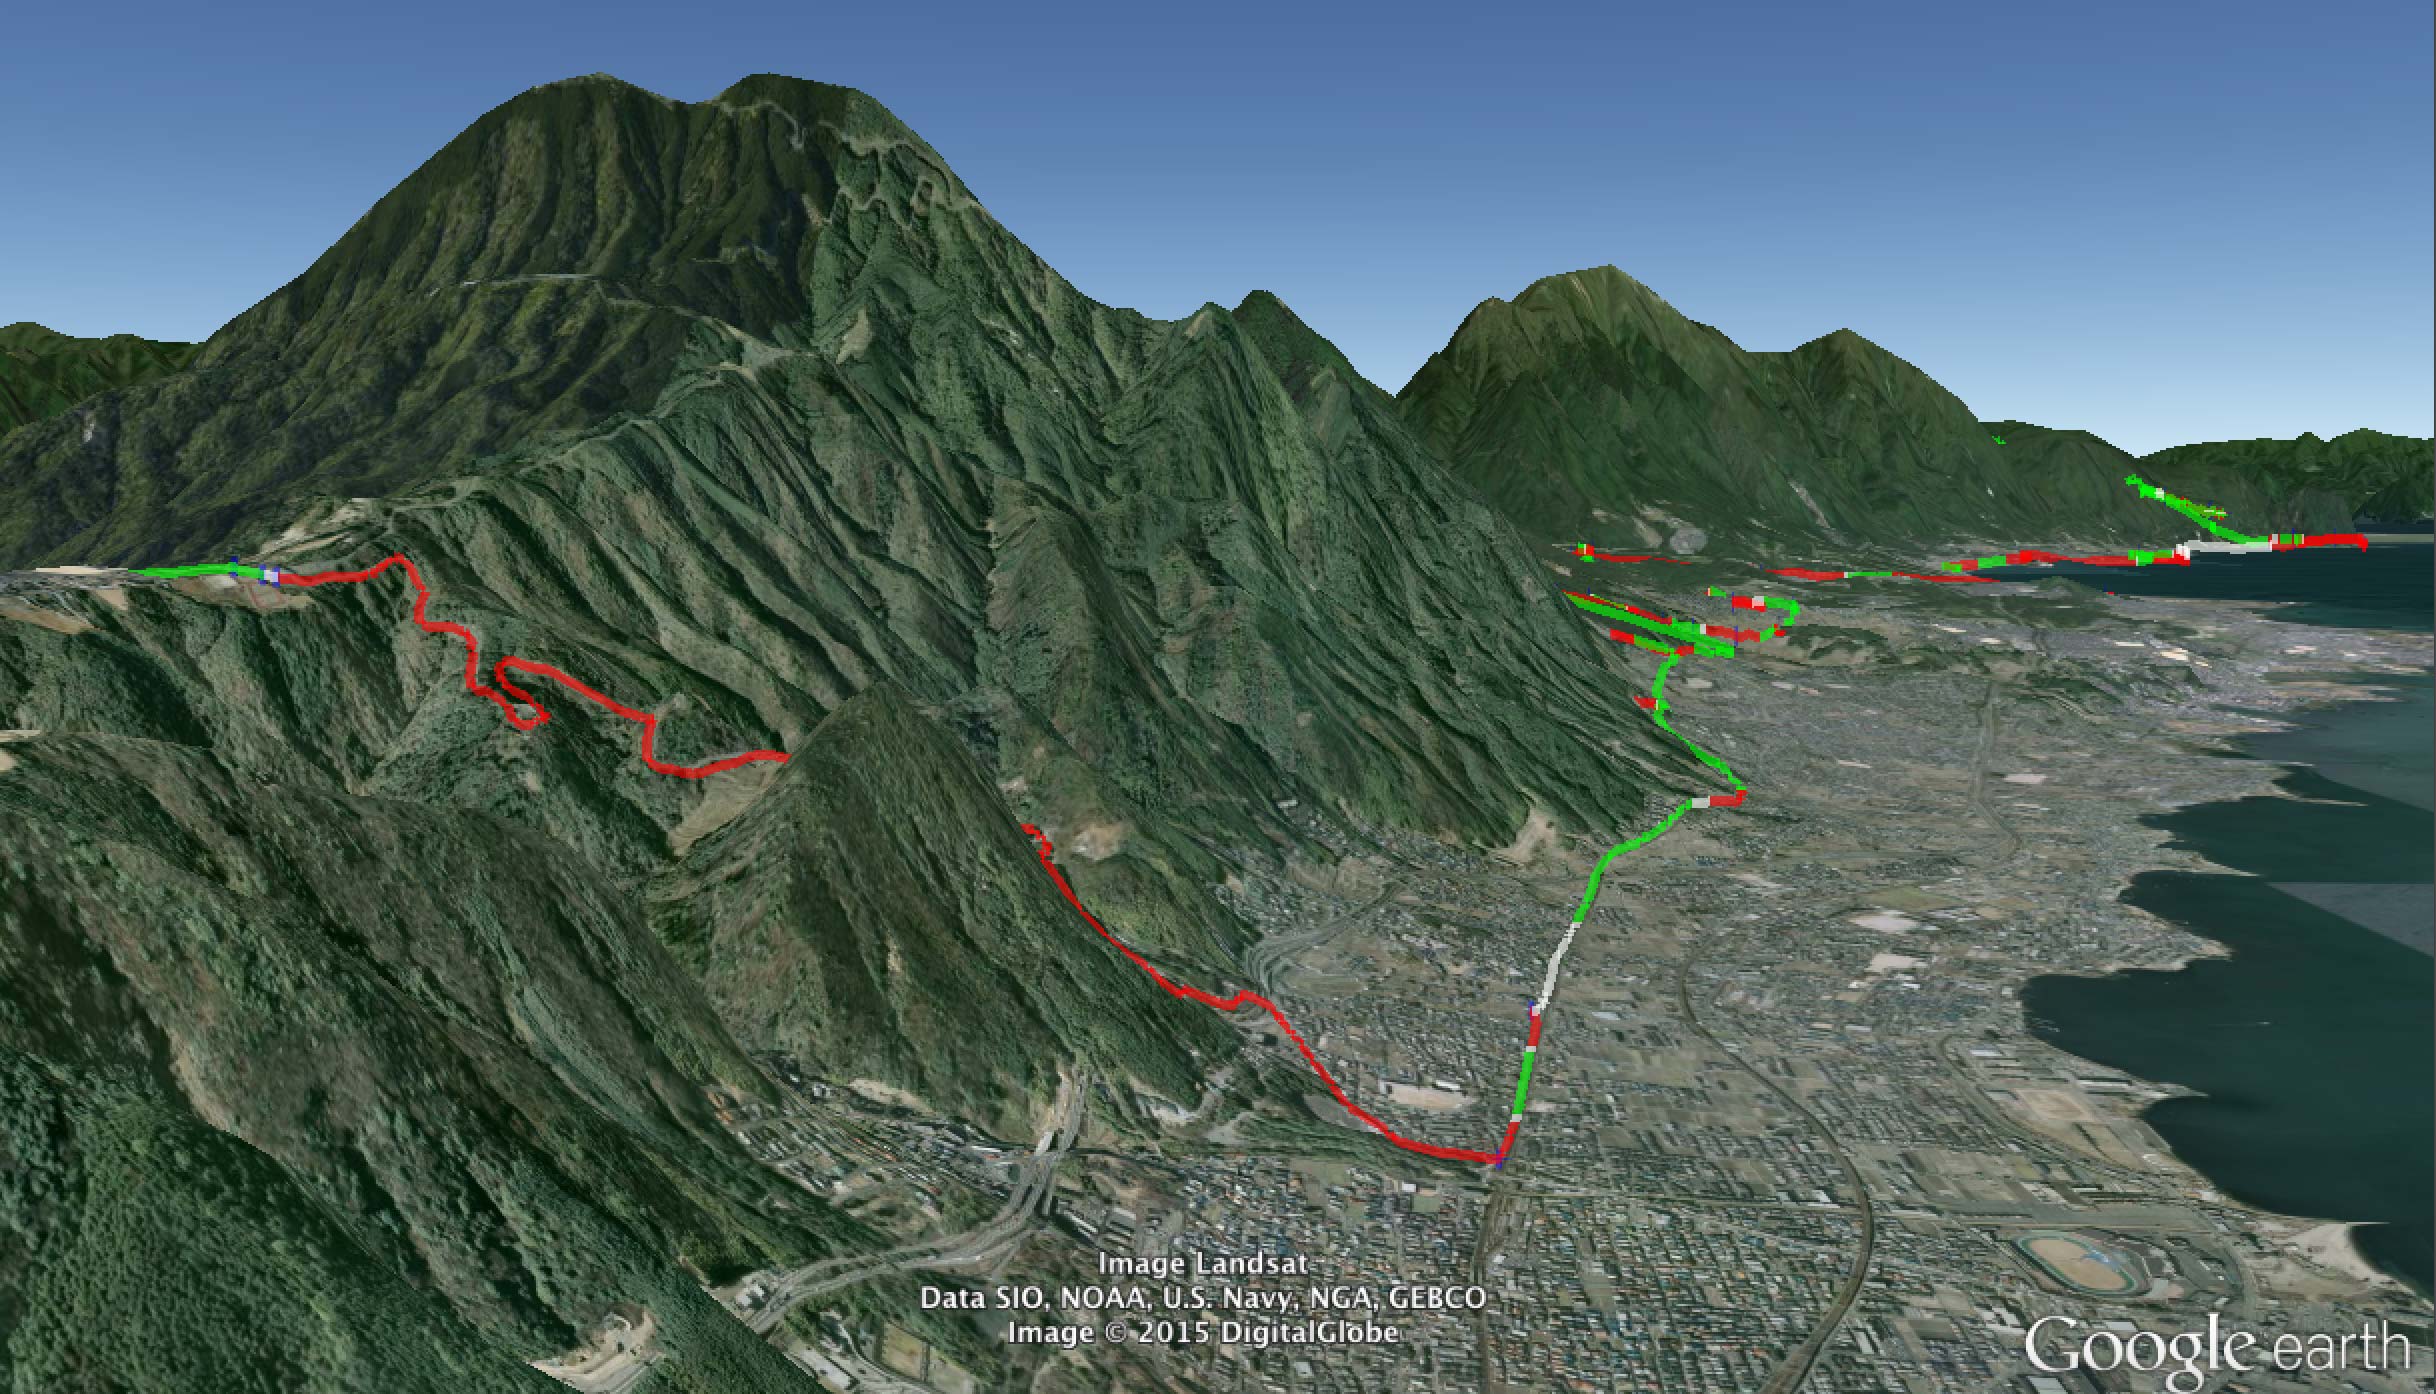
A Light Mountain Climb After Lunch
340m climb from the village of Kurodani, Takashima City, Shiga Japan
高島市黒谷からの山登り
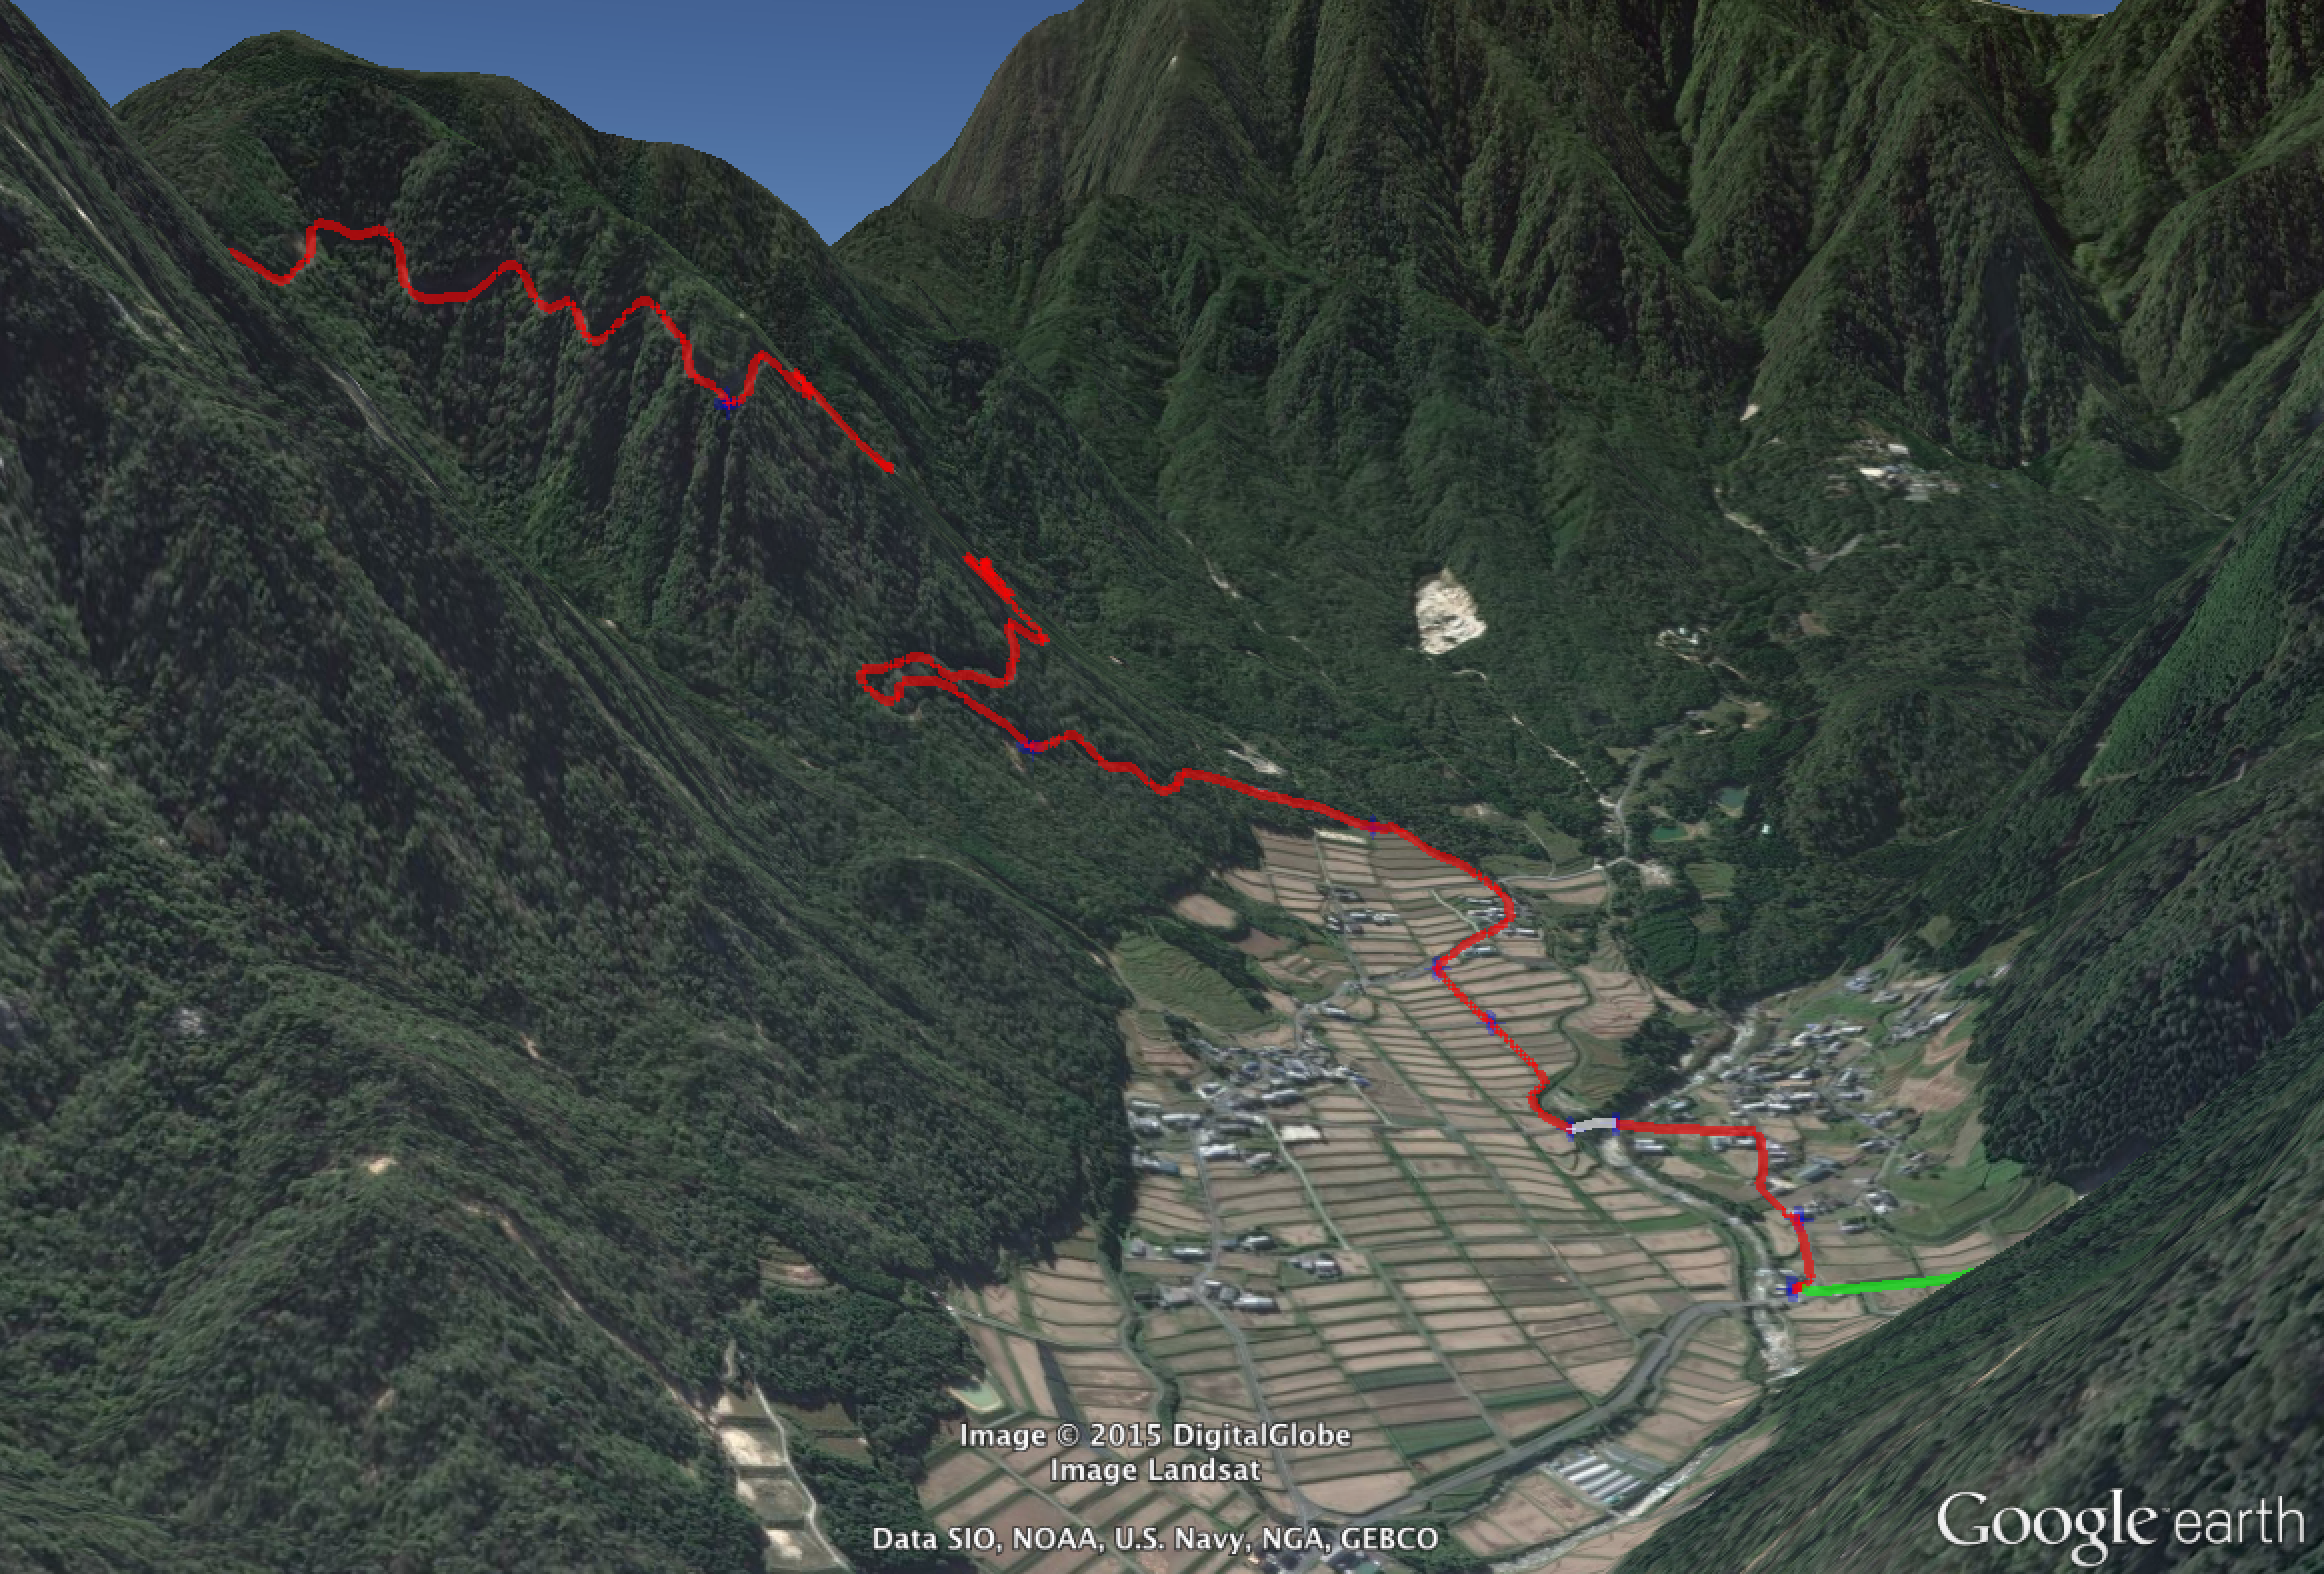
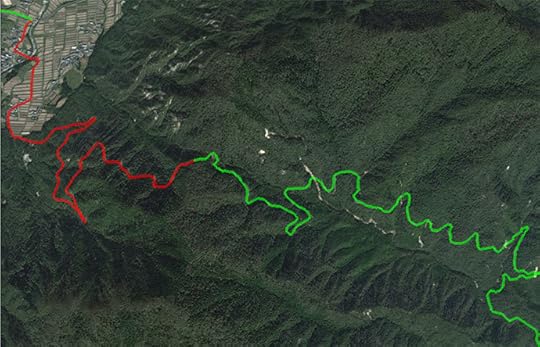
In the screenshot of Google Earth above, you can see the route that I rode my
bicycle last Wednesday... the little bit of green coming in from
the right is a downhill section of road, followed by the long red uphill section
through the tiered rice paddies of the village,
then up the mountain on an old road no longer open to traffic.
I'd ridden 55km (34mi) to get to that point, and would end up riding
72km (44mi) farther before I got home, but ever
since my first “real” ride in
February, I've not been so interested in how much distance I've covered,
but rather, in how much mountain I've conquered. This means the important
statistic for me is how much “vertical
climb” or “elevation gain”
I did during a ride,
the sum of all the rises/climbs/ascents on the route.
And it's not just me... vertical climb is often used as a badge of
achievement for a ride, and seems to get more talk than distance. It's a strong reflection for how tough a route is.
The problem is that it's difficult to figure out the vertical climb for
a particular route, and commonly-used methods are often wildly
inaccurate.
Cyclers I've met record the ride with a GPS unit of some sort
(their iPhone, a bike computer, a runner's watch, etc.) and upload the
data to Strava, a service that allows
you to analyze your activity and share info about it with others. It's very popular and mostly very well done.
For example, I mentioned it in my previous post about a long mountain bikeride
that I did on April 30th, where Strava had informed me that I had beaten my
record for a particularly tough mountain climb:
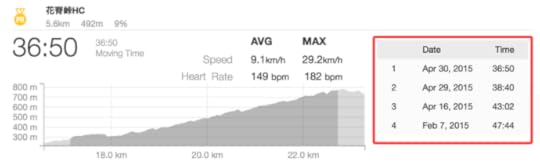
Data About My Rides
Courtesy of Strava.com
Footnote: I've since beat it again, but by only 10 seconds.
When you upload your data to Strava, they calculate your vertical climb
for the activity, and display it prominently. For example, the
aforementioned first real
mountain ride shows some impressive stats:
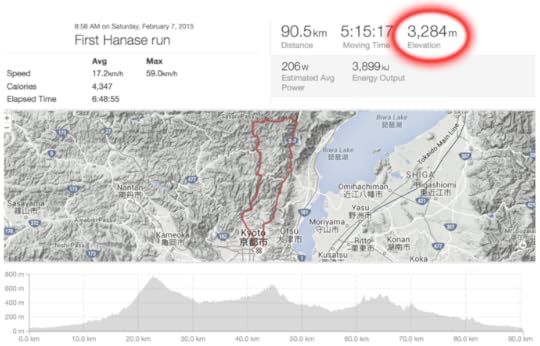
Since it was my first real ride, I didn't know any better but to be
impressed by the 3.3 kilometers (2 miles!) of vertical climb that I'd done. I was amazing. I was Superman.
Unfortunately, it's all a lie.
Over the course of several big mountain rides, I'd started to feel that
the numbers reported on Strava were quite a bit inflated, but I couldn't put
my finger on exactly how.
A week or so ago I posed about another ride, “Short but Intense Bike Ride in Northern Kyoto”, where someone commented
about the apparent discrepancy between reality and what Strava reported
(and hence what I claimed). This spurred me into investigating, and I've
spent the last week digging in, writing tracklog-analysis software, doing
tests, etc.
So, when I went out on a long ride last Wednesday, I brought an
arsenal of equipment with me, recording five separate logs with three
different GPS/GLONASS-equipped devices.
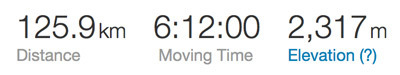
The trip ended up being my longest ride ever, about 125km (78mi), and
also had the most vertical climb I'd ever done in one day. Among the many ways I
recorded the trip's data, I used Strava's mobile
app on my iPhone 6+, and when I was done I had the app
upload all the data to Strava.
Here's what Strava reported about that trip:
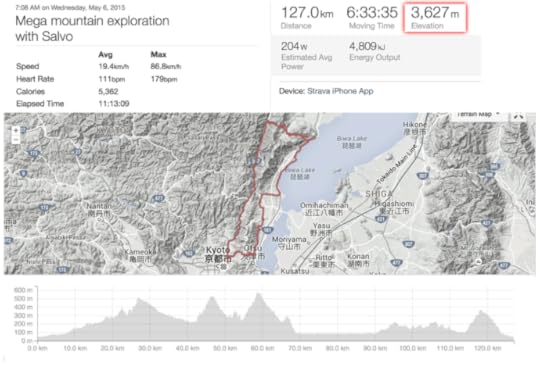
Impressive!
but wrong
The elevation graph at the bottom is an accurate representation of the
11-hour ride, with four separate major mountain peaks transversed, along
with many little ones (though they each didn't seem little at the
time!).
Strava informs me that the trip encompassed an impressive 3,627m
(11,900') of vertical climb. It looks like I started at about 50m and initially climbed to about
500m, and from there went down and up quite a bit
— and believe me, I did — but looking
at the graph it's difficult to come up with a 3,637m sum for all the “up” parts.
In reality, I believe the vertical climb on the trip was about 2,225m (7,300').
First, let's look at why Strava's numbers are so wrong, then let's look
at how to get a better answer.
There are various ways a unit can record your elevation as you travel,
and all of them are generally untrustworthy. Modern units like an iPhone
or a dedicated unit like a Bad Elf GPS Pro+
have three methods to figure altitude: GPS,
GLONASS, and a
barometric altimeter.
GPS/GLONASS can be fairly accurate with your latitude and longitude, as I've discussed in prior
posts, such as
“Informal GPS Logger Test: iPhone 4s GPS is Shockingly Good”
and
“Another Informal Location-Logger Test”.
It's fantastically-amazing technology that is perhaps the only
time we come in contact with something that must actually take into account
Einstein's
general theory of relativity. But it's not perfect, and of the three
dimensions, elevation is by far the least accurate.
Consider these views of three GPS/GLONASS units' tracklogs plotted in Google Earth,
of various sections of last Wednesday's ride:
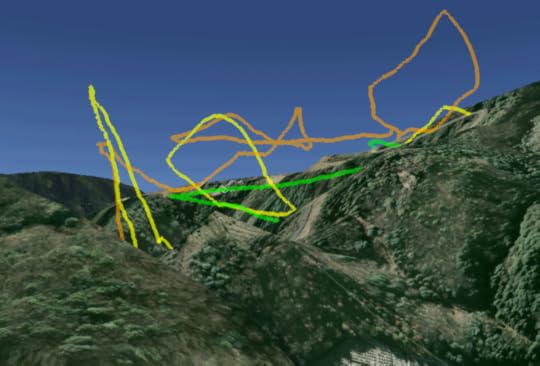
The three units rarely agreed with each other on the elevation, nor any
of them with Google data as seen in Google Earth, and they each in their
own way tended to wander off wildly at times. (The tracks, when viewed
directly from above, all matched up with each other and the road quite
well... it's only the elevation data that was, so to speak, all over the
map.)
When wishing to track vertical climb, the absolute accuracy of a unit is
not particularly important, it's the relative accuracy and stability that
are important, and it seems that barometric altimeters provide better results.
My first experience with a barometric altimeter, on a Garmin GPS unit a decade
ago, was very bad. If there was a breeze or you walked with the unit, it
would record a non-trivial change in elevation (up or down, depending on
how the unit was physically angled relative to the air movement). It was ridiculous.
Things seem better now. On last Wednesday's trip, I had two barometric
altimeters with me, the one in my iPhone 6+, and another on a Bad Elf GPS+.
Here's their plots for the last section seen above:
Anyway, a naïve calculation of vertical climb looks at each data point
and, if the elevation of a point is higher than
the previous point, add the difference to the total. Minor errors that
result in small fluctuations over the short term result in wildly-inflated
overall results, but one can smooth the raw data (e.g. with a moving average) to get more realistic results. That's
apparently what Google Earth does, so let's look at what it calculates for
each of my five tracklogs:
UnitTypeGoogle-Earth Vertical-Climb Calculation
BadElf GPS+ GPS/GLONASS3,479m11,414'
BadElf GPS+ Barometric 2,174m7,133'
Garmin eTrex 20GPS/GLONASS3,265m10,712'
Apple iPhone 6+GPS/GLONASS2,215m7,267'
Apple iPhone 6+Barometric 2,009m6,591'
That's quite a range of results from the very same trip. Which is correct?
Frankly, probably none of them.
As we'll see later, there are techniques we can use to eke out some
fairly reasonable results, but first let's see what Strava actually
does...
What Strava Does
Strava's iPhone app has access to both iPhone altimeters (barometric and
GPS/GLONASS), but in the end it uses neither. Rather, it throws away that
elevation data and instead relies on its own database of elevation data
(likely the same data that Google uses to show 3D elevation in Google
Earth).
Strava's approach may well be fine in generally-flat areas, but it produces
ridiculously-overinflated results in the mountainous areas I've checked, and
it's easy to see why...
I created some software to analyze the tracklogs, smooth local
irregularities, and present uphill sections in red and downhill sections in
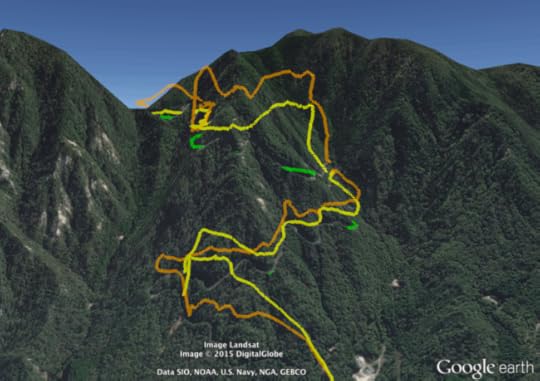
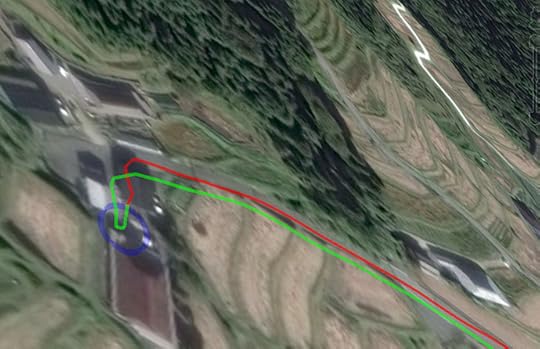
green. Let's look at the mountain shown in this article's lead photo, a
long climb followed by a long, enjoyable descent down the other side...

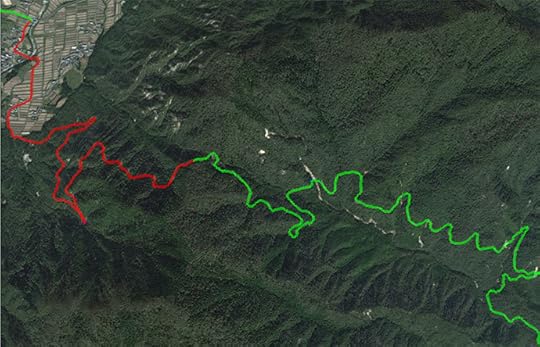
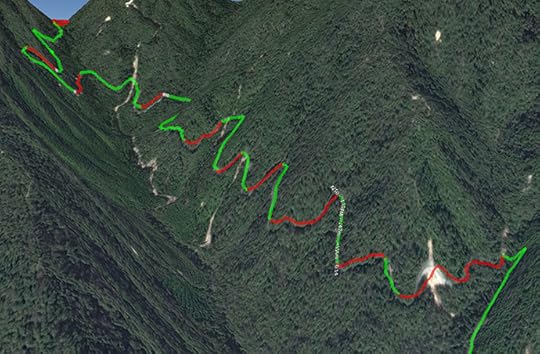
Reality
red means uphill, green means downhill
Both the climb and the descent were quite straightfoward;
the climb was a solid climb without any downhill breaks, and the descent was a solid descent
without any uphill sections. That's why the ascent is a solid red line above, and the
descent is a solid green line.
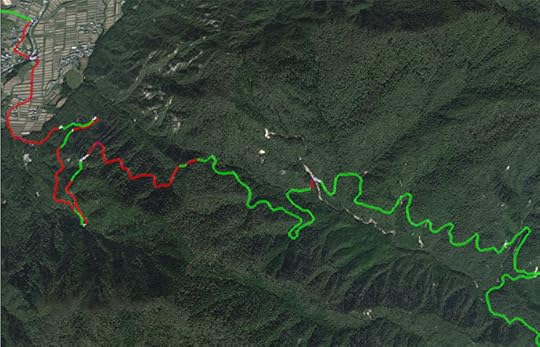
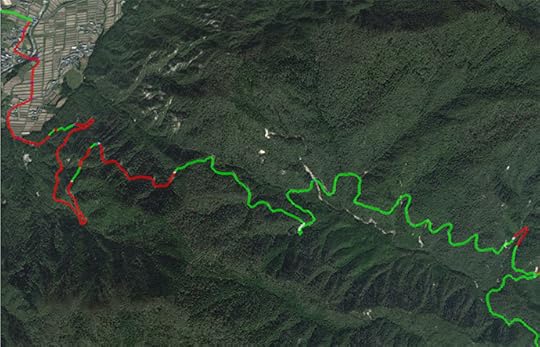
Now, let's look at how Strava sees it, as well as all my data sources...
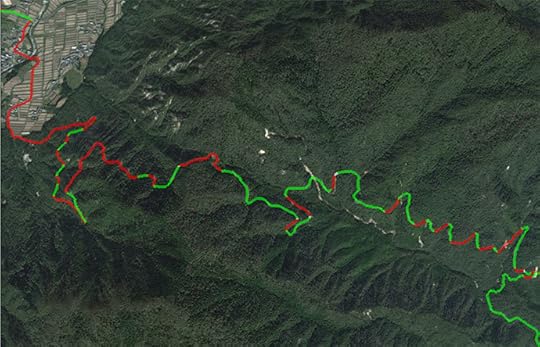
from Strava's elevation data
Bad Elf GPS+ (using its barometric altimeter)
Bad Elf GPS+ (using GPS/GLONASS)
iPhone 6+ using GPS/GLONASS, as recorded with the Galileo Offline Maps app
Garmin eTrex 20 (GPS/GLONASS)
iPhone 6+ using barometric altimeter, as recorded with Abvio's Runmeter app
span.b015 { font-size: small; padding: 2px; border: gray 1px solid }
Strava
- BE (baro)
- Garmin (GPS)
- BE (gps)
- iPhone (GPS)
- iPhone (baro)
mouseover a button to see that image
The Strava data shows many ups and downs on both sides of the mountain... ups and downs that
simply weren't there. It's easy to see why when you look at the mountain in Google Earth (which I believe
uses the same elevation data) from the side. Here's the side of the mountain that I rode down:
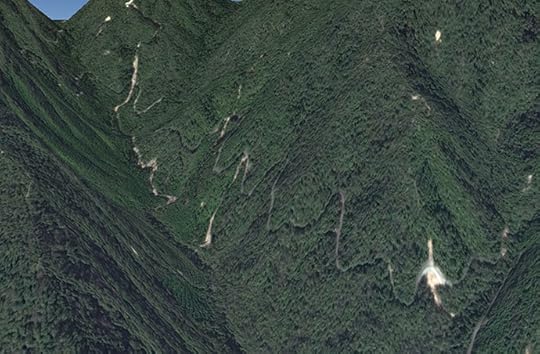
very-3D mountain pressed into a mostly-2D face
The road appears undulate up and down as it makes overall progresses lower, and to Strava,
the “ups” count as vertical climb:
Strava “detects” many false climbs (216m/700' just in this view alone)
Of course, the road doesn't undulate up and down (it progresses “monotonically” down),
but it does undulate
side to side around ravines cut into the side of the mountain by eons of water and wind. You can sort of see the proper undulation in this path created with a barometric altimeter:
descending around ravines that do exist, but which aren't presented in Google Earth
I should be clear that I'm not complaining about Google... the resources
they've freely gifted to the world in Google Earth and Google Maps
continues to amaze me, and I'm extremely thankful for them.
I'm not quite sure that I'm complaining about Strava. Perhaps these
easily-avoidable inflated results are particular to my area of Japan, and
the rest of the world enjoys added accuracy due to Strava's policies. I don't know. But I do know
that a lot of folks around the world complain
about Strava's inflated elevation claims, so at least I know that I'm not
alone.
So How Can We Do Better
First of all, I should note that Strava does respect the recorded
elevation in some situations where it recognizes that the data was recorded
with a barometric altimeter. Their own iPhone app, however, either doesn't
use the barometric altimeter or doesn't notice that it does, so users get stuck
Strava's elevation data.
Where Strava does accept a device's elevation data, they offer the user
a way to get “corrected” data, whereby Strava throws away the user's data
and replaces it with their inaccurate elevation-database data. This results
in a much less accurate result for many folks, but they offer no way to
undo this action, so if you bump the link by accident, you're hosed.
They also don't allow you to toggle between your device elevation data
(barometric or not) and their data. It seems that they really want to push
their data, and who can blame them? Folks like me early on, ignorant of the
hyper-inflated vertical-climb data, get an ego boost from seeing the big
numbers. I suppose boosted egos help their business interests.
(I'm thankful for their service, which I have enjoyed without cost. I just wish this aspect were better.)
Luckily, one crack in their anti-reality armor is that they allow geeky
types like me to create tracklogs with other devices, then modify
the tracklog to force Strava to accept the elevation data as is, and upload
that.
Massaging Tracklog Data
I've spent the last few days writing software to analyze tracklog data,
to smooth it out, and to derive meaningful information from it.
The first step is to identify when you're stopped, because if you're not
moving, you should have no elevation gain or loss, no speed... nothing.
You're stopped.
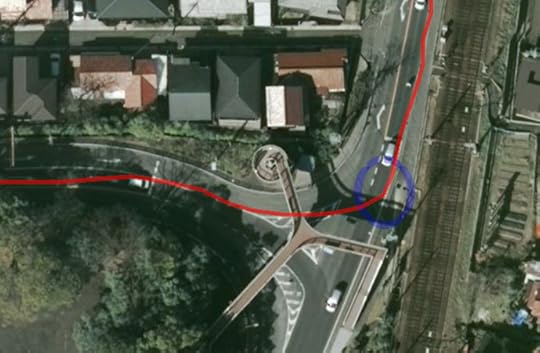
Unfortunately, GPS receivers tend to record drifting locations when
stationary, such as the hour I spent visiting
someone (this
sweet lady) in the mountains along the way on Wednesday's long ride:
this is what an hour's complete lack of movement looks like
My analysis figured out that all that movement didn't really get me anywhere, so it filters it out
and marks the stopped location with a little blue ring:
“pause” detected
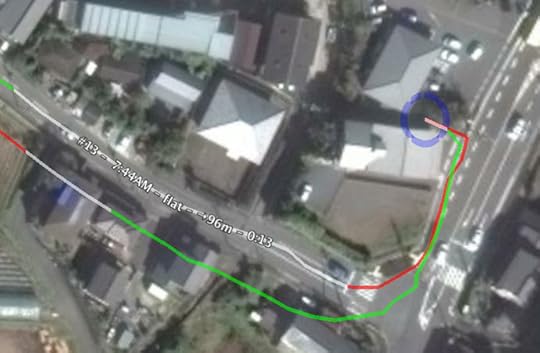
I have my software note the length of the pause in the KML label, like this:

My pause detection seems to be highly accurate, and I compared its
results with the reality that I remembered on the trip, and it's pretty much perfect. It even accurately detected a 10-second pause at an intersection waiting for a few cars to clear
before I crossed over:
10-second pause for traffic
45-minute pause wandering in and around a convenience store
while waiting for a friend to join me on the trip
Then my software goes through the entire trip to find the highest peak
and the lowest valley, and pin the elevation at those locations. That
divides the whole trip into four parts, each of which is subject to the
same analysis, and this analysis recurses (repeats onto itself) over and
over until the difference between a local peak and a local valley is almost
within the range of noise.
Once all these local peaks and valleys are found, the elevation of all
the points in between are smoothed using a moving average. The elevation of
each peak/valley point is left undisturbed, and it's the elevation rise
between them that adds up to the trip's vertical climb.
After all this analysis, the software prepares a KML file that shows
the trip, with red lines for climbs, green for descents, and white for flat sections
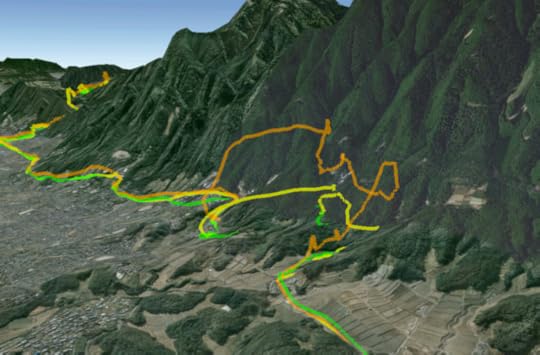
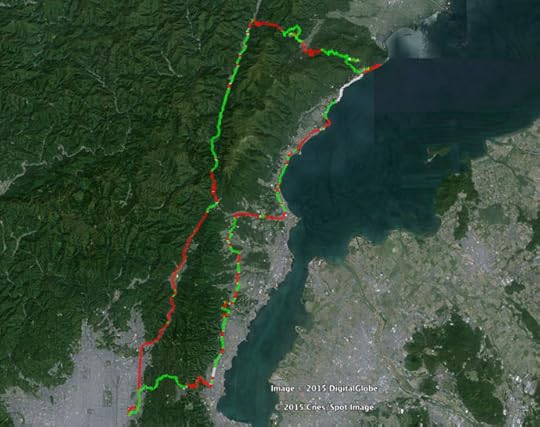
(and, optionally, the blue circles for pauses). Here's one view of the second half of my trip:
Looking North up the eastern side of Lake Biwa
The red line at the far right ends at the Shirahige Shrine (seen here in the
report on a ride two weeks ago), which we visited briefly after having come
over the mountain, before turning south to ride home.
The distance from the shrine in the background to the spot in the
foreground where the route turns 90 degrees and pitches up into the
mountains is 30km (18mi) as the crow flies, which I mention for scale.
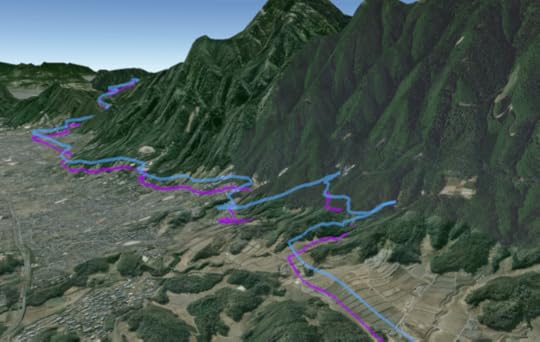
Here's the whole 125km (78mi) trip:
If you'd like to see it yourself, you can download the KML file
(with pauses /
without pauses)
to view in Google Earth.
The “with pauses” view is best for me when I want to “relive the experience”, and I can see,
for example,
that I stopped for half an hour — 31:26 — to eat lunch (at this place
that I last visited seven years ago), and then progressed up the mountain stopping at intervals
for photos, to check directions, or to fix a popped chain.
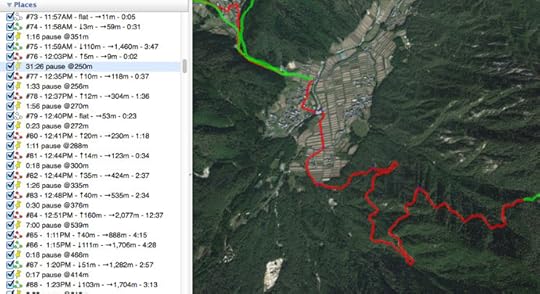
That view is pretty cluttered if all I want to do is analyze whether the vertical-climb data seems reasonable,
so for that the “without pauses” version is better:
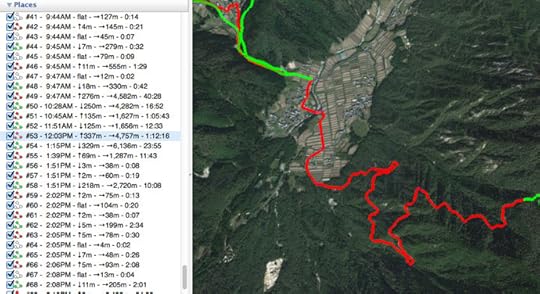
The duration includes all the intervening pauses, rendering it fairly
meaningless, so I should probably simply remove it, but at the moment it's
still there.
Anyway, I did this analysis on all my tracklogs, and found that the one produced
by the Bad Elf GPS+ with barometric altimeter seemed to most match reality, so that's the one
I consider, relatively speaking, “correct”.
And after all this analysis and cleaning and smoothing, I'm left with a tracklog that I (relatively speaking) trust,
so I prepare it so that Strava won't override the elevation data, and upload it. Strava doesn't know that I've
grooomed it, so it does its standard processing, and comes up with this:
They somehow came up with an extra 100m of vertical gain, but since I
truly don't know what the actual value is, I can't say that they're any
less wrong than I am.
So, now that I have the ability to derive a realistic vertical-climb
value, to be honest with myself I must go back and correct prior trips:
table#t2568a td:nth-child(2) { text-align: left; padding-left:1em; padding-right: 0.5em }
table#t2568a td.ft { font-size: small; white-space: no-break }
Date
Event
Vertical Gain
Claimed at the Time
Vertical Gain
Realistic Value
Strava
Inflation
(in feet)
Jan 24
My first tentative outing on bike
N/A
685m
→ 2,090'
Feb 7
My first real mountain ride
3,850m
1,517m
274%
12,630' → 4,620'
March 3
Kuyataki Waterfall with Manseki
762m
540m
141%
2,500' → 1,650'
March 4
Group ride southeast of Kyoto
1,787m
1,282m
140%
5,860' → 3,910'
April 16
“Highly Visible” mountain ride
1,607m
1,180m
136%
5,270' → 3,600'
April 23
Pleasant 105km lake ride
1,300m
?
4,200' →
April 29
Coffee at Cowbell
1,720m
991m
174%
5,600' → 3,020'
April 30
Revisiting my first big mountain ride
3,159m
1,609m
196%
10,360' → 4,900'
I didn't have a good barometric-altimeter tracklog for one of the rides.
The amount of “Strava inflation” is shocking. If I could solve this
problem for myself in a couple of days, you'd think a real company with
presumably smart folks could come up with something.
Anyway, I'll need to find a better app for keeping tracklogs on the
iPhone, one that lets me record both the GPS/GLONASS elevation and the
barometric elevation, and also my heartrate. As it
is now, I'll use a klugy mixture of
various devices and combine all the data myself, massage it, smooth it, and
then send it to Strava.
If they ever get around to addressing this, I suppose that would be a
good time to bring up the next issue: they ignore elevation changes when
calculating distance. They correctly
note that the difference is perhaps at most 2%, but on a 100km ride that can still
be over a mile wrong.
Overall, I guess Strava is just not as anal about statistics as I am...


Jeffrey E.F. Friedl's Blog

- Jeffrey E.F. Friedl's profile
- 13 followers

