
Ed Lazear on the Current Outlook
From CNBC yesterday:
A government jobs report, like the one for March, that’s so out of whack compared to expectations usually sparks admonishments from market watchers not to make too much out of any single monthly data set.
But leading labor economist Ed Lazear said Monday that this time is different. “The reason I pay a little bit more attention to this one, it’s not just one month, it’s a series of indicators—almost all of which—are pointing in the same direction.”
I wondered what indicators Professor Lazear was speaking of. Instead of downloading a whole set, I retrieved from FRED four key indicators cited by the NBER BCDC in dating the 2001 recession (the set is larger in recent trough dating, see here), available as of 4/7.
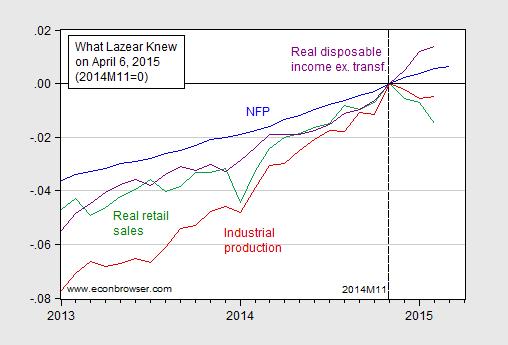
Figure 1: Log nonfarm payroll employment (blue), industrial production (red), real retail sales (green) and real personal income ex.-transfers (purple), all normalized to 2014M11 = 0. Source: BLS, Federal Reserve Board, St. Louis Fed, and BEA via FRED, and author’s calculations.
NFP and real disposable income continue to rise, while industrial production and real retail sales have declined in recent months. Now if one is worried by this picture (and I am slightly), one should’ve been very worried by this one (first included in this post).
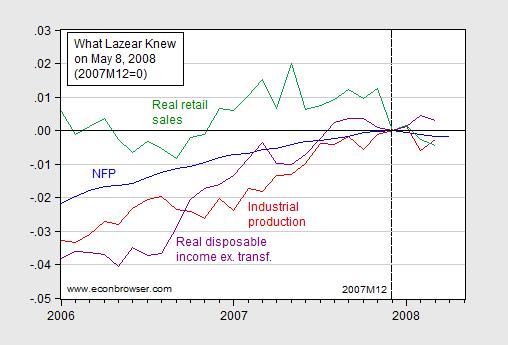
Figure 2: Log nonfarm payroll employment (blue), industrial production (red), real retail sales (green), and real disposable income excluding transfers (purple), all normalized to zero at 2007M12; data available as of May 8, 2008. Source: St. Louis Fed ALFRED database, and author’s calculations.
And yet, knowing these data, Professor Lazear, in his capacity as CEA Chair stated on May 8th, in somewhat less circumspect terms:
“The data are pretty clear that we are not in a recession.”
(This is a quote from a WSJ article entitled “Lazear Sees No Recession for U.S. Economy”.)
Additional data on overall economic activity is shown in Figure 3.
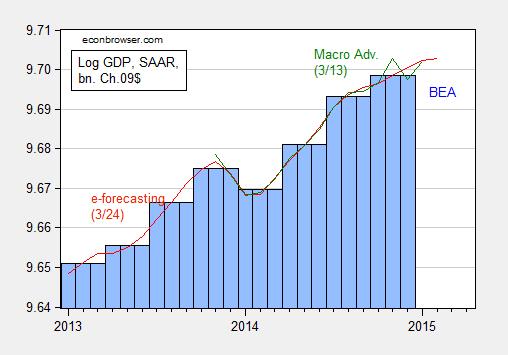
Figure 3: Log GDP from BEA (blue bar), and from e-forecasting on 3/24 (red), and from Macroeconomic Advisers on 3/13 (green), all in bn. Ch.2009$ SAAR. Source: BEA 2014Q4 3rd release, e-forecasting, Macroeconomic Advisers, and author’s calculations.
The NBER BCDC refers to GDP and the Macroeconomic Advisers monthly series in dating peaks and troughs. Those indicators seem to point against a downturn (but, recalling the cautionary tale of Don Luskin, I won’t say a downturn is impossible!).
If one were worried about recession, then one illuminating time series is the behavior of the term spread, which as I have recently noted has some predictive power for future growth, as well as recessions (based on Chinn and Kucko, 2015).
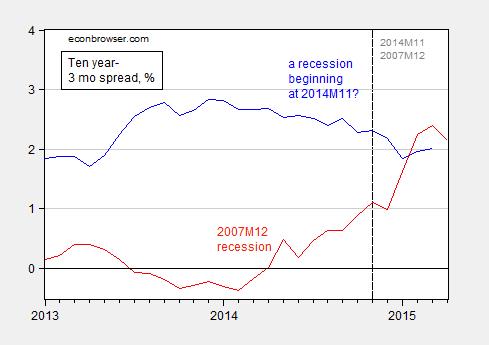
Figure 4: Ten year minus three month Treasury spread (blue), and normalized to the 2007M12 recession (red), in %. Source: FRED and author’s calculations.
The ten year-3 month spread went negative in August 2006, 16 months before the recession’s beginning (according to NBER). The ten year-3 month spread has not yet inverted (and using the shadow Fed funds rate would make the spread larger, not smaller).
On one point, Professor Lazear and I agree — it is too early for the Fed to start increasing the policy rate.


Menzie David Chinn's Blog


