
Guest Contribution: “Analyzing Recent Trends in the U.S. Wealth Distribution”
Today we are fortunate to present a guest contribution written by Ricardo T. Fernholz, Assistant Professor of Economics at Claremont McKenna College.
Recent trends in income and wealth inequality have drawn much attention from both academics and the general public. Atkinson, Piketty, and Saez (2011) and Saez and Zucman (2014), among others, document these trends for different countries around the world and have prompted a substantive debate about the underlying causes and the appropriate policy responses, if any.
A General Approach
In new research (Fernholz, 2015), I develop a general statistical model of wealth distribution to address these issues empirically. This approach overlaps both the empirical literature on income dynamics (Guvenen, 2009; Browning et al., 2010) and the broader literature on Pareto distributions for income, wealth, and other economic variables (Gabaix, 1999; Benhabib et al., 2011; Jones and Kim, 2014). A key difference between my approach and these literatures, however, is that I impose no parametric structure on the underlying processes of household wealth accumulation and do not model or estimate these processes directly.
Despite this minimal structure, I use new techniques to obtain a simple household-by-household characterization of the stable distribution of wealth. Using this characterization, I show how the model can replicate any empirical distribution and then construct such a match for the 2012 U.S. wealth distribution as described by the data of Saez and Zucman (2014).
The U.S. Wealth Distribution, Present and Future
The U.S. wealth shares data of Saez and Zucman (2014) have attracted attention recently by demonstrating an upward trend in top wealth shares starting in the 1980s, an observation that suggests that U.S. wealth is transitioning from one distribution to another. If this is the case, it is natural to wonder where the distribution is going.
My statistical approach to wealth distribution is able to provide estimates of the future U.S. stable distribution. These estimates depend only on the current rate of change of wealth shares in the economy, not on the causes of these changes. I consider four transitioning wealth shares scenarios:
The 2012 U.S. wealth distribution is stable.
The share of wealth held by the top 0.01% of households is increasing by 1% per year, while the share of wealth held by the bottom 90% of households is decreasing by 0.5% per year.
The shares of wealth held by the top 0.01% and 0.01-0.1% of households are increasing by 1.5% and 0.5% per year, respectively, while the share of wealth held by the bottom 90% of households is decreasing by 1% per year.
The shares of wealth held by the top 0.01% and 0.01-0.1% of households are increasing by 3% and 1% per year, respectively, while the share of wealth held by the bottom 90% of households is decreasing by 1.5% per year.
In Figure 1, I plot the future stable distributions of wealth for these four scenarios. The substantially different outcomes implied by these scenarios demonstrate how sensitive the future distribution is to upward trends in today’s top wealth shares. In the case of Scenario 4, top wealth shares are increasing so quickly that the distribution never stabilizes but instead separates into divergent subpopulations, with the top 0.01% of households eventually holding all wealth (represented by the vertical line in Figure 1). I emphasize that these hypothetical estimates are not intended as predictions but rather as descriptions of the trajectory of inequality in the absence of changes in the economic environment.
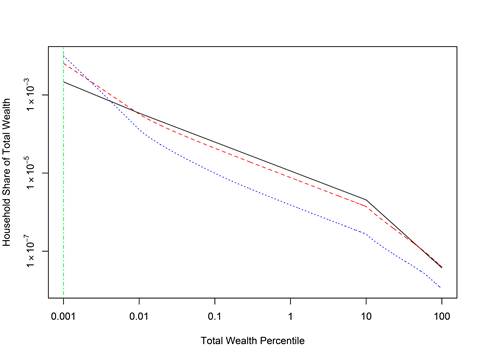
Figure 1: Household wealth shares under Scenarios 1 (solid black line), 2 (dashed red line), 3 (dotted blue line), and 4 (vertical dot-dashed green line).
Interestingly, it is difficult to reject a divergent trajectory as in Scenario 4 for the current U.S. wealth distribution. Indeed, according to the data of Saez and Zucman (2014), the share of wealth held by the top 0.01% of households in the U.S. has increased by an average of more than 3.5% per year since 2000 and more than 4% per year since 1980—faster than is assumed in Scenario 4. A cautious interpretation of this fact is that further increases in top wealth shares are likely in the near future.
Estimating the Effects of Progressive Capital Taxes
Ever since Piketty (2014) proposed a progressive capital tax in response to increasing wealth inequality, much of the debate surrounding this policy has centered on how such taxes are likely to increase government revenues or distort economic outcomes, rather than how they might affect the distribution of wealth. My model can provide estimates of the distributional effects of progressive capital taxes on the U.S. economy. These purely empirical estimates do not rely on any assumptions about the underlying causes of inequality.
Because it is a useful baseline case to consider, the estimates I present here assume that a capital tax rate of 1% on some subset of households reduces the growth rate of wealth for those households by 1%. Although this leaves out incentive effects of the taxes, these effects can be incorporated into the model by adjusting the tax’s impact on the growth rates of household wealth. In Figure 2, I show the effects of a progressive capital tax similar to the policy proposed by Piketty (2014). In particular, this tax sets the capital tax rate for the top 0.5% of U.S. households equal to 2% and the rate for the top 0.5-1% of U.S. households equal to 1%, while the remaining 99% of households are assumed to neither pay nor receive any tax or subsidy.
Figure 2 displays the effects of this tax on the U.S. wealth distribution, assuming that the 2012 U.S. wealth distribution is stable (Scenario 1). As the figure shows, a progressive capital tax imposed on just 1% of households in the economy reshapes the distribution of wealth and reduces inequality. In fact, the after-tax stable distribution of wealth in this case is similar to the distribution observed in the U.S. in 1978 (the dotted green line in Figure 2), one of the most egalitarian in the U.S. in the last century.
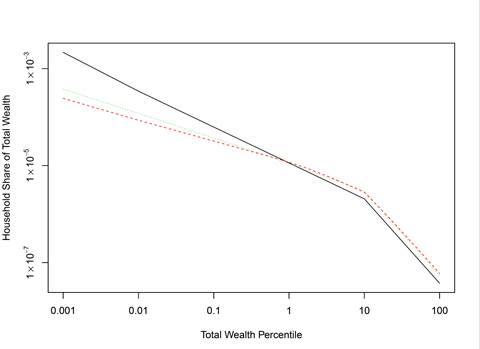
Figure 2: Household wealth shares with (dashed red line) and without (solid black line) a 1-2% progressive capital tax on the top 1% of households under Scenario 1, and for the U.S. in 1978 (dotted green line).
I emphasize that this result is neither a statement about total welfare nor an endorsement of a progressive capital tax. My statistical approach only generates empirical estimates of the distributional effects of taxes and other policies, it does not measure the potentially large distortions or costs associated with such policies.
Interpretation
A measured interpretation of my results is important. Indeed, there remains uncertainty about the true state of U.S. wealth inequality today. While the quantitative results about the future U.S. wealth distribution and the effects of progressive capital taxes shown in Figures 1-2 are useful, a more important contribution is to introduce an empirical methodology that can address these questions without making assumptions about the causes or consequences of inequality. As more wealth shares data become available in the future, this methodology should yield even more information about the future of U.S. wealth inequality.
References
Atkinson, A. B., T. Piketty, and E. Saez (2011, March). Top incomes in the long run of history. Journal of Economic Literature 49(1), 3-71.
Benhabib, J., A. Bisin, and S. Zhu (2011, January). The distribution of wealth and fiscal policy in economies with infinitely lived agents. Econometrica 79(1), 123-157.
Browning, M., M. Ejrnæs, and J. Alvarez (2010, October). Modelling income processes with lots of heterogeneity. Review of Economic Studies 77(4), 1353-1381.
Fernholz, R. T. (2015, January). A Statistical Model of Inequality. mimeo, Claremont McKenna College.
Gabaix, X. (1999, August). Zipf’s law for cities: An explanation. Quarterly Journal of Economics 114(3), 739-767.
Guvenen, F. (2009, January). An empirical investigation of labor income processes. Review of Economic Dynamics 12(1), 58-79.
Jones, C. I. and J. Kim (2014, October). A Schumpeterian model of top income inequality. mimeo, Stanford GSB.
Piketty, T. (2014). Capital in the Twenty-First Century. Cambridge, MA: Harvard University Press.
Saez, E. and G. Zucman (2014, October). Wealth inequality in the united states since 1913: Evidence from capitalized income tax data. NBER Working Paper 20265.
This post written by Ricardo Fernholz.


Menzie David Chinn's Blog


