
The Low-Pay Recovery, Re-Assessed
From the Senate Republican Policy Committee Chair, John Barrasso, commenting on the December employment report:
The December jobs report, while posting 252,000 new jobs, reveals it’s still too soon to be bullish on an economic recovery. Wage data and labor force participation remain concerning.
Stagnant wage growth remains a weight on America’s economic recovery. In December, average hourly earnings for all employees on private nonfarm payrolls fell by five cents, to $24.57.
It might be time to re-assess this characterization of stagnant wages and particularly of a low-wage job recovery.
First, with the revised figures released on Friday, the drop in December hourly earnings was reduced to four cents; and the seven cent increase in January more than compensated for the drop (which some commentators attributed to calendar effects).
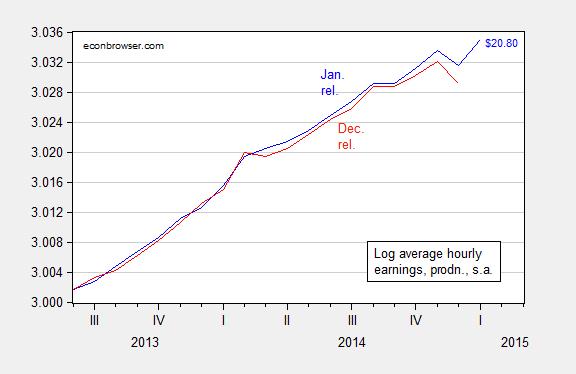
Figure 1: Log average hourly earnings for production and non-supervisory workers, private sector, in dollars, seasonally adjusted, January release (blue), and December release (red). Source: BLS via FRED, and author’s calculations.
Second, nominal labor compensation, measured in a variety of ways, is higher, even as headline CPI inflation has been muted. The CEA compiled the following table which summarizes the evolution of compensation over the past year, and compares to the CPI.
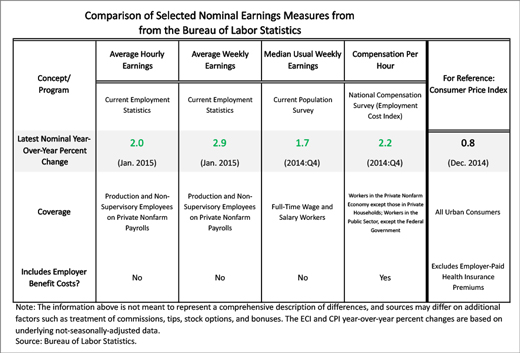
Table from CEA (February 2015).
Finally, an interesting communication today from Torsten Sløk at Deutsche Bank (not online), who critiques the observations that ‘“this remains a low-quality recovery” and “the jobs that are created are all low pay”’.
This is simply not correct. Average hourly earnings [for all private workers] currently stand at $24.75. The chart below shows job growth in industries that pay more than the average and job growth in industries that pay less than the average. It is clear from the data that this recovery has not only been low wage jobs.
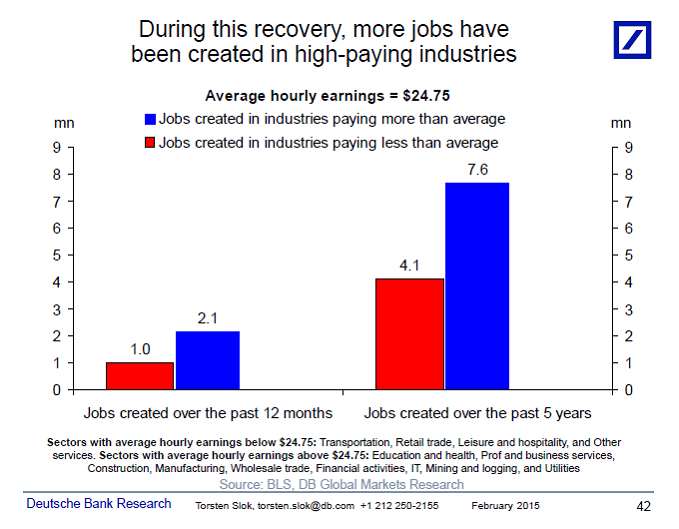
Figure 2: from Torsten Sløk.
In addition, here is a depiction nominal and real average hourly wages for all private sector workers (not just production and non-supervisory).
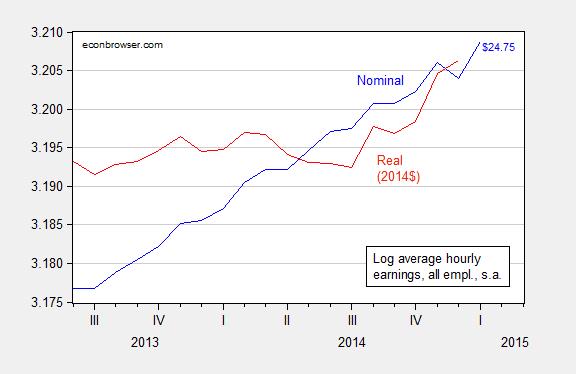
Figure 3: Log average hourly earnings for all workers, private sector, in dollars, seasonally adjusted, January release (blue), and in 2014$ (red). CPI-all used for deflation. Source: BLS via FRED, and author’s calculations.


Menzie David Chinn's Blog


