
Some Observations on the 2014Q4 GDP Release
The external sector weighs in, and thinking about the length of the recovery.
First note the contribution of exports and imports to growth (in an accounting sense), in percentage points.
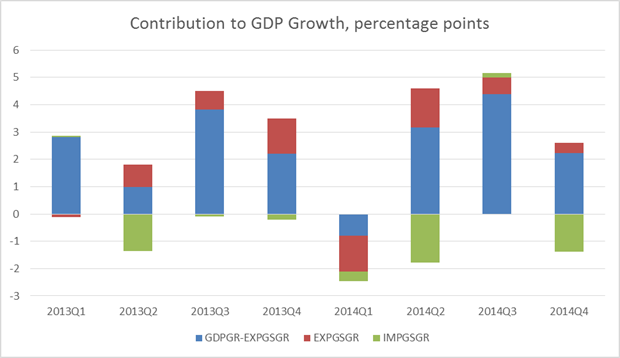
Figure 1: Contributions to real GDP growth, in percentage points of imports (green), exports (red), and all else (blue), all SAAR. Source: BEA 2014Q4 advance release, and author’s calculations.
Instead of having an essentially net zero impact in the third quarter, import growth contributed -1.4 percentage points (annualized). To the extent that the higher growth in imports represents greater consumption in anticipation of a sustained recovery, the news is good. The slowdown in export growth is not helpful, on the other hand. The evolution of real exports and imports is shown in Figure 2.
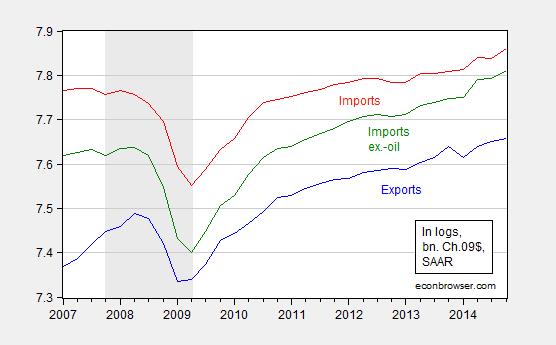
Figure 2: Log real exports (blue), imports (red), and imports ex.-oil (green), all SAAR, bn. Ch.09$. Source: BEA 2014Q4 advance release, and author’s calculations.
Some of this is due to an appreciated dollar; I read a lot about the impact of the stronger dollar, but it’s important to keep in context the appreciation thus far.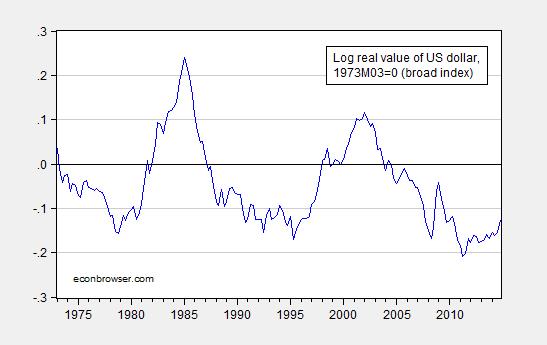
Figure 3: Log real value of the US dollar, against a broad basket of currencies, 1973M03=0. Note 2014Q4 observation is average of October and November. Source: Federal Reserve Board via FRED, author’s calculations.
So, in the absence of a continued substantial appreciation, one shouldn’t worry about the recovery being derailed on this account alone — unless US goods have become much more substitutable for foreign in the past fifteen odd years. That could be the case. (More here).
On the other hand, Deutsche Bank, in its forecasts released today, argues the dollar is only halfway through its appreciation from the July 2011 trough (FX Forecasts and Valuations, January 30, 2015).
Hence, I do think that the Fed should take into account external developments. To the extent that expansionary monetary policy in the Eurozone and Japan put upward pressure on the dollar’s value, it doesn’t seem problematic to counter that effect by going slow on tightening monetary policy. This is particularly true given the absence of inflationary pressure in headline inflation, and modest growth in labor compensation as indicated in todays productivity and costs release.
The other observation I have on the GDP release pertains to the length of the recovery. The last recession ended, by the NBER’s reckoning, in June 2009. That means that by the end of 2014 (assuming a recession had not already begun), the recovery has now lasted 66 months. To place this in perspective, I show the length of the current recovery in a graph from an article in the Economist nearly two years ago.
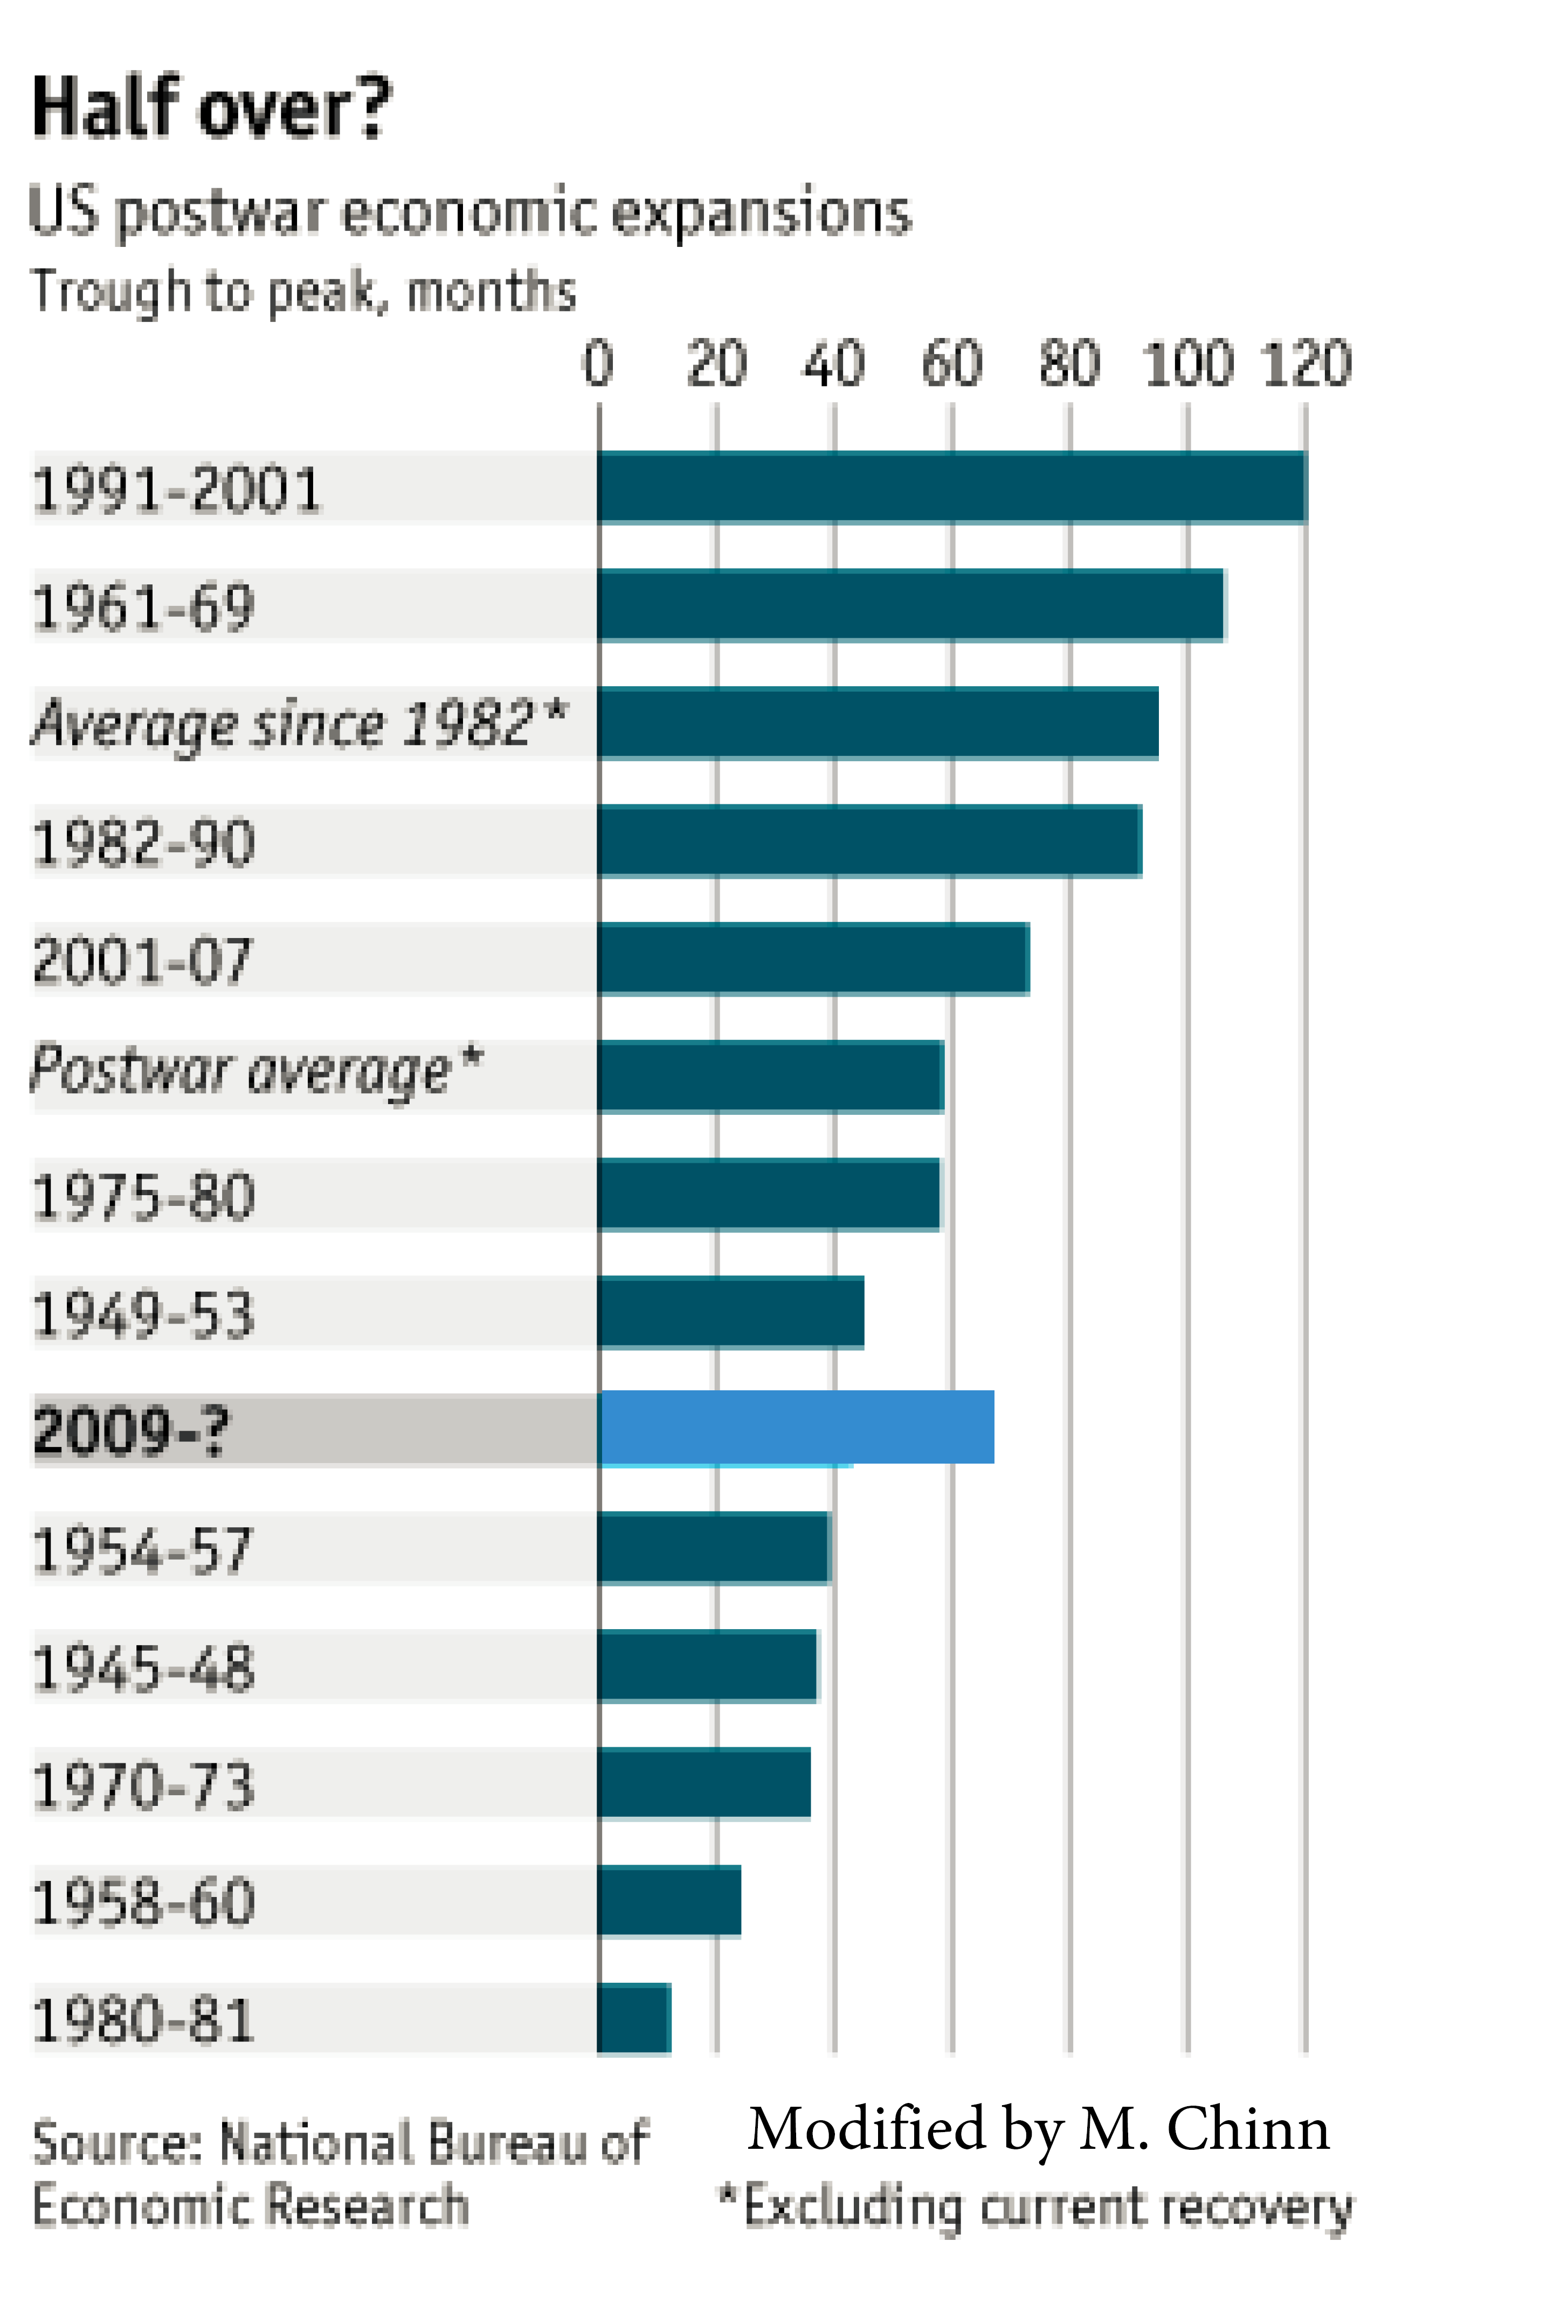
Figure 4: Graph, adapted from “Business Cycles: Running out of Time?” Economist (January 2013).
What the (updated) graph shows is that by the standards of post-1982 recoveries, this recovery has not yet matched the duration of an average recovery. Hence, some (but by no means all) of the anxieties expressed in the Economist article have been allayed.
Now, this is a somewhat mechanistic way of thinking about recovery duration. One should also think about shocks from abroad (Euro area, China), but without knowing if and when such shocks might strike, then one can think about what usually ends a recovery — and there it often seems to be a tightening of monetary policy. That’s yet another reason to worry about over-eagerness in tightening, especially as the dollar appreciates.
Fortunately, for now, the yield curve is not signaling a recession in the next year [1].
For more on the release, see CR, and Furman/CEA.


Menzie David Chinn's Blog


