
Hottest on Record
Global temperatures in 2014, that is.
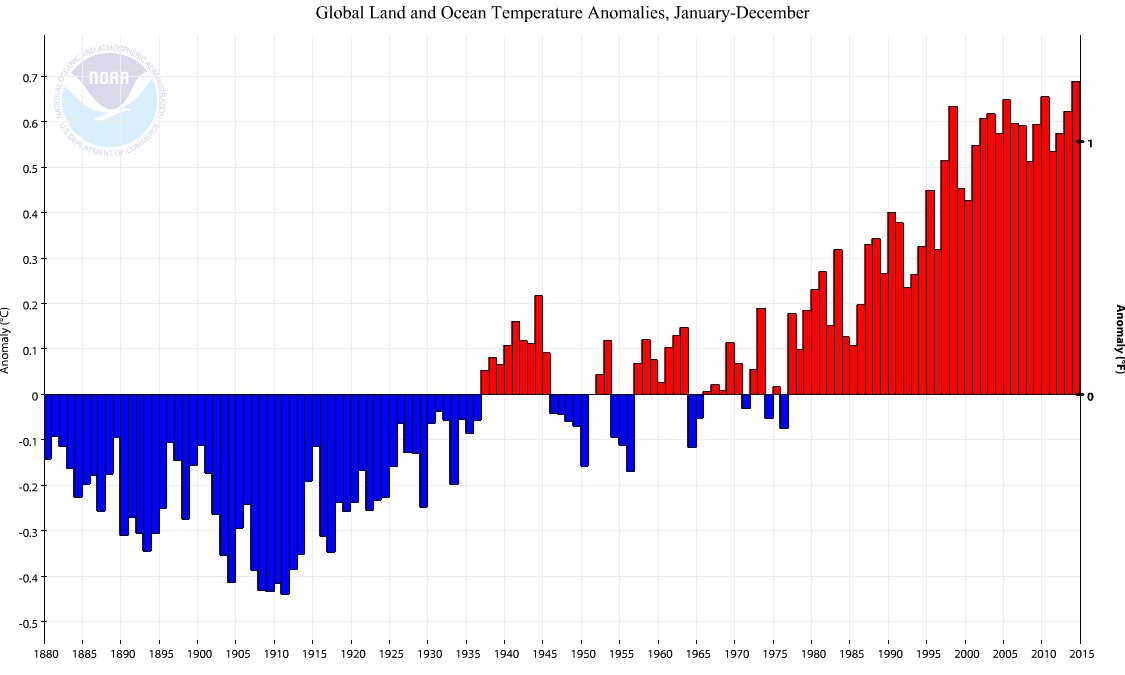
Source: NOAA.
Update, 1/17, 12:45PM Pacific: Since Rick Stryker has asked for statistical significance, but is apparently unable to do statistical testing on his/her own, I will spend some time walking through a quick check.
Download annual data on plotted anomaly, http://www.ncdc.noaa.gov/monitoring-r...
Test for unit root, allowing for constant and trend. You will reject the no unit root null using most versions of the DF test, over entire 1880-2014 sample.
Find the break with the associated lowest p-value/highest significance level in constant, time trend specification; I obtain 1944.
Test for unit root, allowing for constant and trend. You will reject the no unit root null using most versions of the DF test, 1944-2014 sample. You will reject the null, again.
Run a regression of anomaly on constant, time trend; use HAC robust standard errors. I obtain a trend coefficient of 0.01, standard error of 0.001, t-stat for null beta=0 of 9.89.
In my book, that’s enough to reject the null zero-trend hypothesis.
But then, again, Rick Stryker believes 500,000 jobs/month is a typical job creation rate in a recovery!!!! Not true even when one normalizes for labor force, as discussed here. Here’s the rule: When Rick writes, prepare to laugh, and laugh and laugh!!!
Update, 6:45PM: Here is an animation, from that crazy publication, Bloomberg.


Menzie David Chinn's Blog


