
The U.S. Economy: Overview and Prospect: Notes for Orinda, CA, Rotary Club Talk
Part I: Thinking About the Current Business Cycle
The circular flow of economic activity
Everyone's income becomes their spending and investing, which is then someone else's income
Except: When people want to hoard (or de-hoard) their cash
When people want to spend down their cash, (planned) spending is greater than (expected) income
Unexpected inflation
Job of the Federal Reserve to sell bonds and soak that excess cash up to rebalance the economy
When people want to hoard cash, (planned) spending is less than (expected) income
Unemployment and depression
Job of the Federal Reserve to buy bonds and so give the economy the cash it needs to make people comfortable spending and investing their incomes
Private sector cannot do this job: in a panic nothing banks can provide counts as "cash"; in a euphoria everything counts as "cash"
Take away the punchbowl before the party really gets going; but be sure there is a punchbowl
The Situation as of 10 Years Ago
Interest Rates
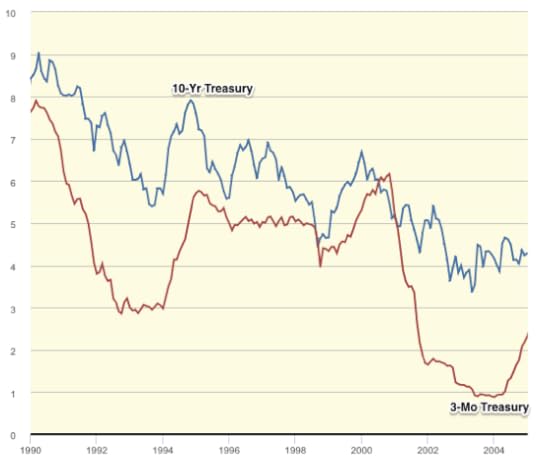
The Federal Reserve back then was trying to manage the economy: full employment and rough price stability
Salient Components of Spending
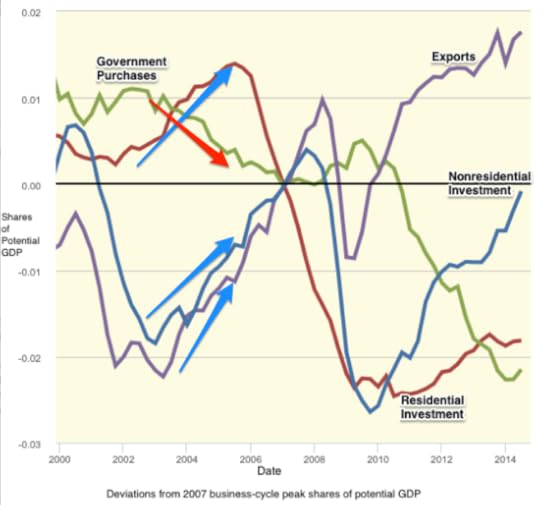
Deviations as shares of potential production from recent business-cycle peak values
As of 2005 we were pretty optimistic about the near-term and medium-term future of the American economy
Worries about budget deficits and trade deficits, but not a source of immediate disaster
U.S. economy had fallen into recession in 2001 for two reasons:
People who had been investing in high-tech businesses decided to hoard their cash
Fall-off in demand for U.S. exports as people elsewhere decided they wanted to hoard more cash inside the U.S.
But recovery was in train
A housing boom
An export recovery as foreigners figured they had about enough assets in the United States
Employment-to-Adult-Population Ratio
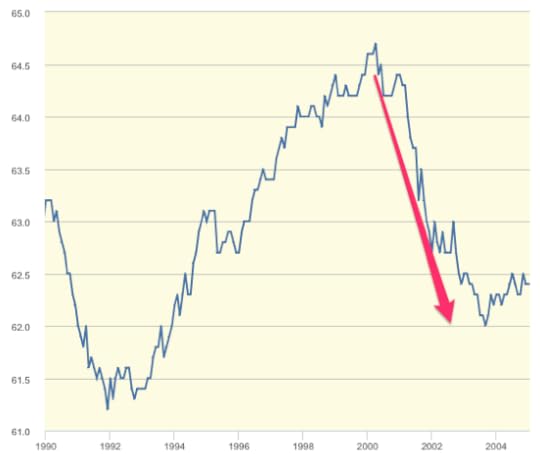
Only big black spot: next to no recovery in employment as a share of the adult population, but that was expected to come in time...
Managing the Correction of Imbalances
Salient Components of Spending
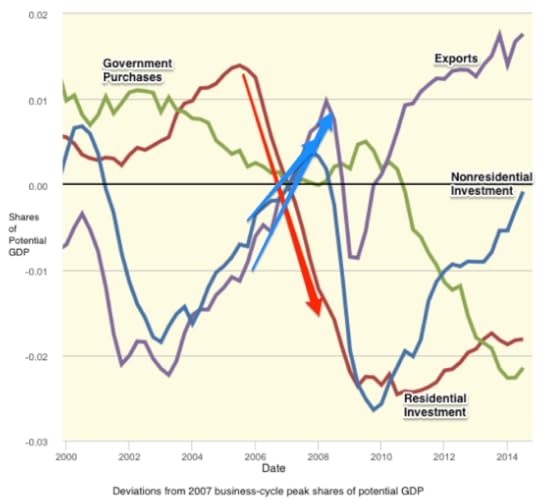
2005-2008: collapse of the housing bubble
Became clear that a lot of the housing investment had been based on people taking on risks that they did not understand--and when they learned what the risks were, they were unhappy
But from 2005-2008 the economy rebalanced--people who had been investing in financing construction shifted to financing exports, business investment instead
The Collapse
Salient Components of Spending
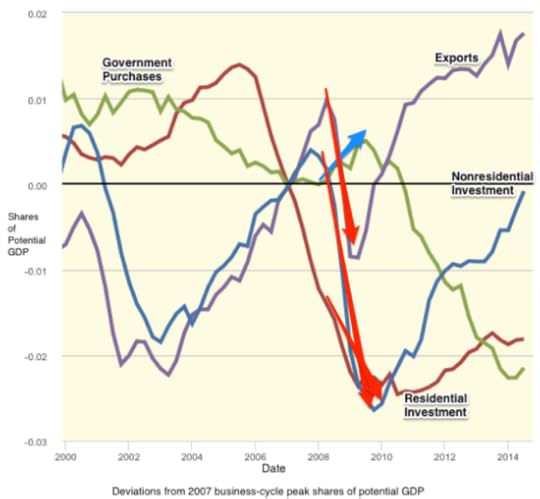
Then the financial crisis...
Should not have happened...
Became clear that not just the "frothier" parts of housing investment were made by people taking on risks that they did not understand, but that Wall Street had no control whatsoever over what its derivative positions were...
A collapse of trust--and an enormous demand for cash to hoard--as (planned) spending fell way below (expected) income
And then actual income fell below expected incomes because spending had collapsed
Employment-to-Adult-Population Ratio
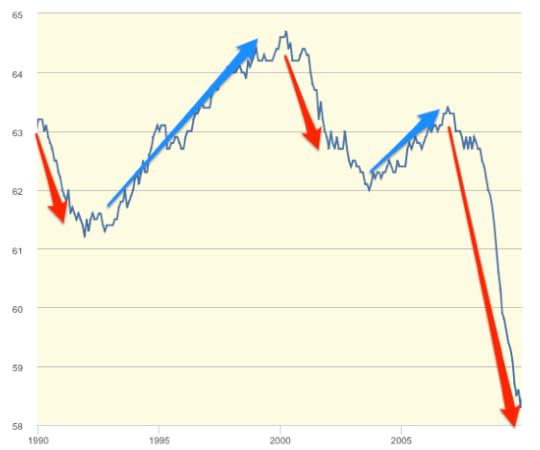
The worst employment decline since the Great Depression
Interest Rates
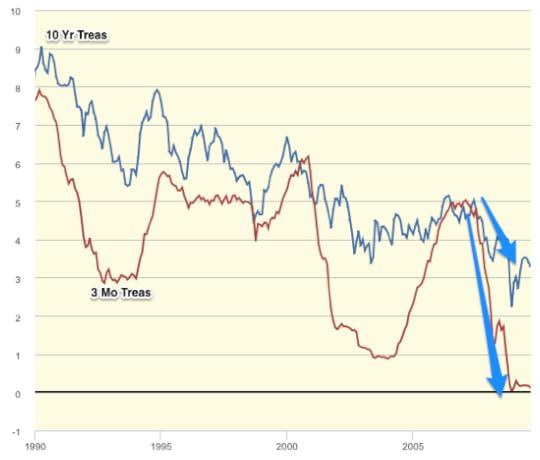
Federal Reserve responds by flooding the economy with cash by buying short-term Treasury bills--but it doesn't work: people are so eager to hoard that they take the cash, sock it into their portfolios, where the Treasury bills used to be, and still demand to hoard more...
The Flatlining
Interest Rates
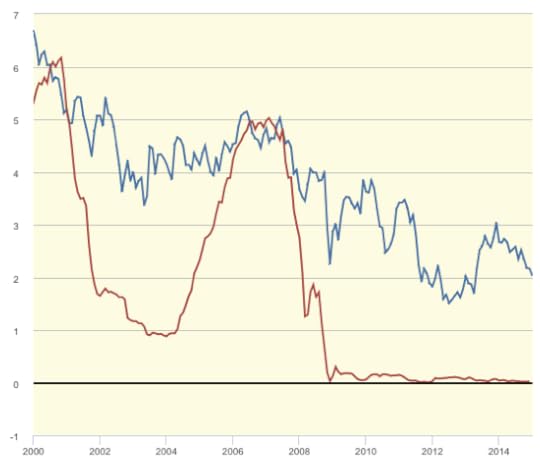
"Quantitative Easing" does not return spending to normal...
Employment-to-Adult-Population Ratio
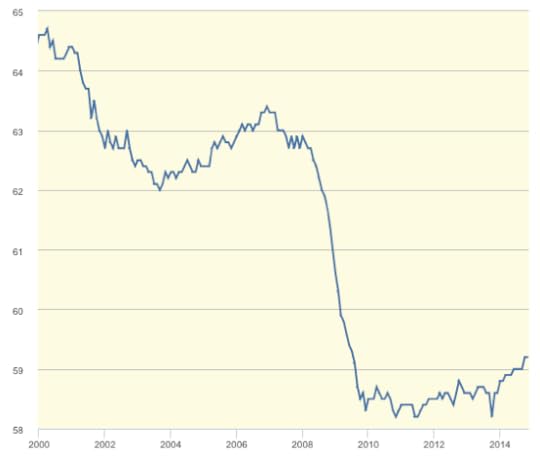
And the employment-to-adult-population ratio does not recover to normal either
Salient Components of Spending
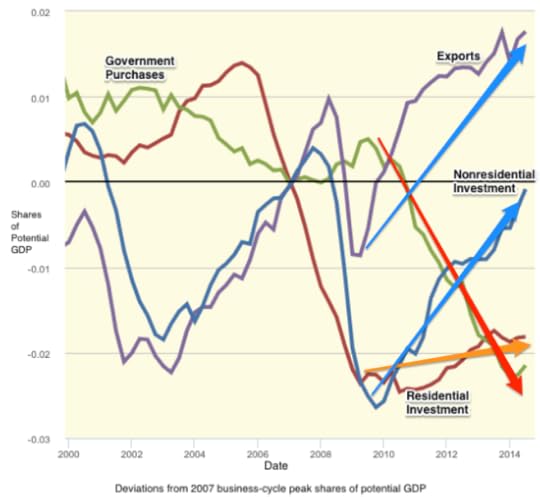
Why not?
Housing finance not fixed--even very low interest rates and ample cash do not induce people to de-hoard that cash and start investing in construction again (except in a few places)
Businesses see that they have ample capacity and are not enthusiastic about spending their cash on capacity that would then sit idle for a while
Exports do bounce back, but there is a depression going on in most of our export markets as well, so that is limited help
And we hit the economy on the head with a brick by cutting way back on what the government purchases
Exactly the wrong thing to do
Why we do it is a mystery
Part II: The Next Two Years
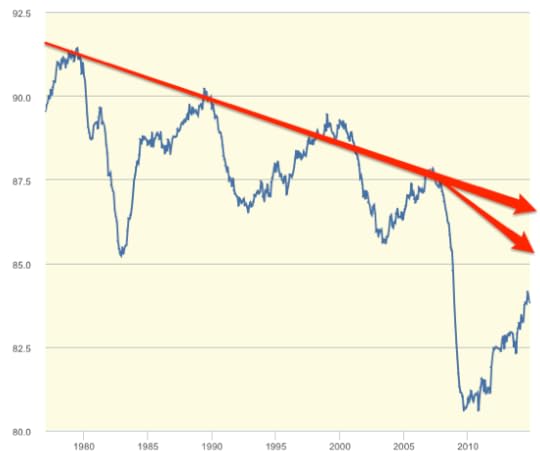
Labor Force Participation and Employment-to-Adult Population
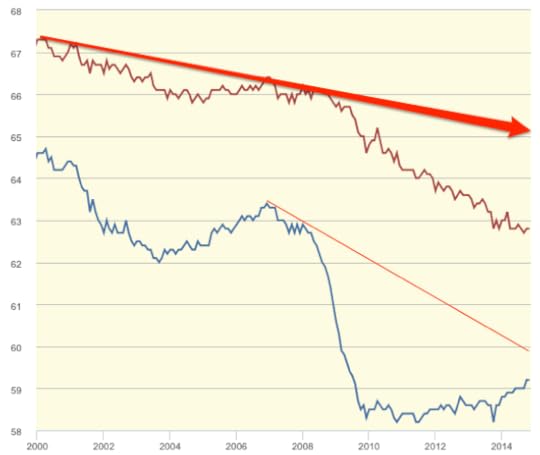
The Federal Reserve is about to start "normalizing" policy
The question of trend labor-force participation
Federal Reserve believes (a) demography is shrinking desired hours, and (b) many of those who lost their jobs in 2008-9 and haven't gotten good ones since are never going to come back
Hence the economy has nearly "recovered to normal"
But not because production and employment have risen from their depressed levels back to normal
Because the financial crisis, the collapse, and the flatlining have done permanent damage that has pushed "normal" down to nearly where we are today...
Inflation-Adjusted Price of Oil
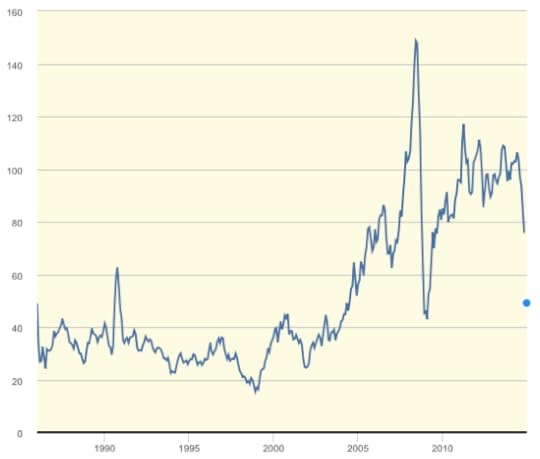
Only bright spot: Saudi Arabia's loss of pricing power in the oil market--that will give a big boost to Americans' incomes and spending
And it will entail a substantial regional shift within America of wealth from Texas-Oklahoma-North Dakota to California-New York-Florida-Illinois
Also: ObamaCare implementation
Part III: The Next Ten Years
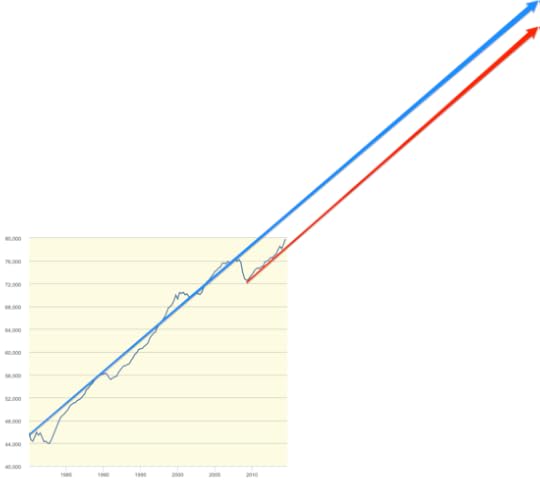
Real GDP
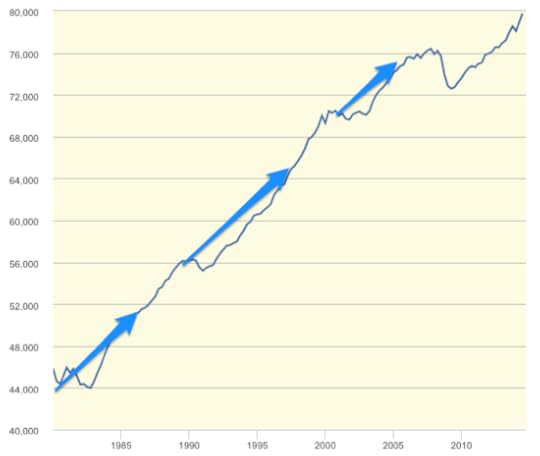
We used to bounce-back from business-cycle downturns and return to normalcy
Real GDP
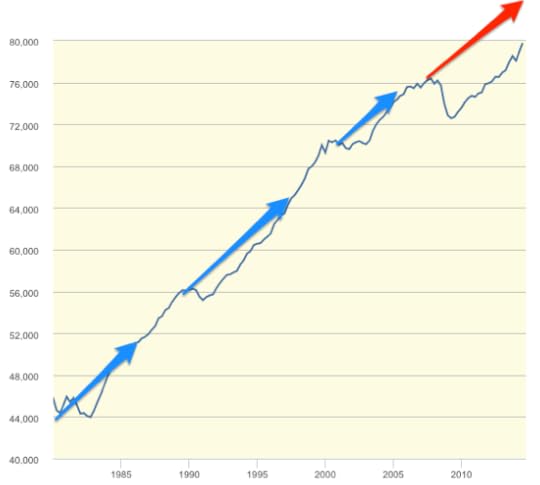
We are showing no signs of bouncing-back from this one
$6,000 per adult in potential production lost--that's $1.2 trillion/year of real wealth that we could be making that we are not, and that it looks like we are never going to recoup.
But we are producing $80,000 per adult a year these days--twice what we were producing in the 1970s. $6,000 a year is very painful--7.5%. But that is only an eight-year delay in the course of economic growth, a "lost growth decade" only.
Data caveats: $80,000/year includes depreciation, benefits, imputed rent on your house, taxes taken out before the money hits your paycheck, and so forth--figure $50,000/year per working age adult of something that looks like "income"
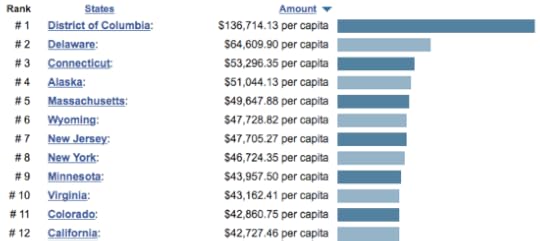
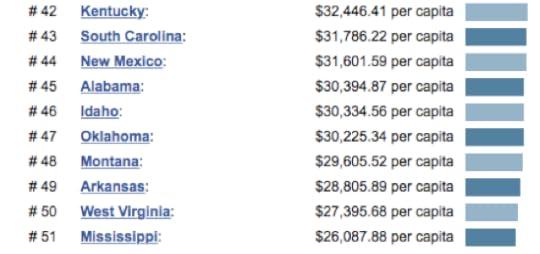
Inequality: The Rise of the 1%
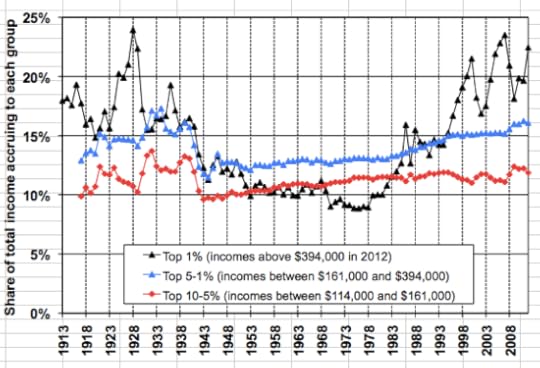
Back in the 1970s--when we had $40,000/year productivity for your average working-age adult--the top 1% took 8%, the rest of the top 5% took 13%, the rest of the top 10% took 12%.
Top 1%: $320,000/year
96-99%: $130,000/year
91-95%: $96,000/year
Bottom 90%: $30,000/year
Today: $80000/year productivity
Top 1%: 24%: $1,920,000/year
96-99%: 16%: $320,000/year
91-95%: 12%: $192,000/year
Bottom 90%: $42,700/year
Inequality: The Rise of the 0.01%
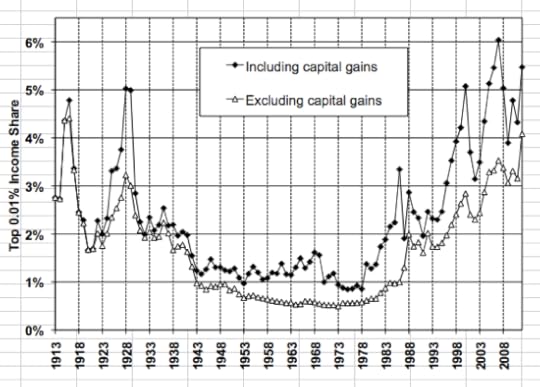
1970s:
Top 0.01%: 1%: $4,000,000/year (12000 people)
Rest of top 1%: 7%: $280,000
Today:
Top 0.01%: 6%: $48,000,000/year (20000 people)
Rest of top 1%: 16%: $1,280,000/year
What are we getting for this rise in inequality? We are paying our top 1% and our top 0.01% very handsomely, yet...
Finance and health-care administration very nearly zero if not negative-sum...
Regional Factors
...
Normally Americans moved to opportunity--to where people were more productive...
Not anymore--the triumph of NIMBYism
Part IV: The Next Fifty Years
Long-Run Impact of the Downturn
$6000 per adult in potential production lost--that's $1.2 trillion/year of real wealth that we could be making that we are not, and that it looks like we are never going to recoup.
Capitalize at 4%/year in real terms, that's a $30 trillion hit in real wealth--$150000 per adult
But perform the same calculation as to how wealthy we and our descendants will be. At a 1.5%/year real growth rate of productivity and a 4%/year real discount rate, our total prospective wealth is $3.2 million per American adult--$640 trillion
Plus the wealth of future immigrants
$32 trillion is painful, but not crushing, in that scale
Long-Run Prosperity: The Math
No reason not to see a growth of 1.5%/year in measured real product per working-age adult over the next 50 years.
Economic growth as measured comes from making cheaper the things we currently make expensively, and there is enormous human ingenuity devoted to that...
$80,000/year x exp(1.5% x 50) = $170,000/year come 2065
Cf: Median household income in Orinda today is $160,000/year
An America that looks--in prosperity--like Orinda today
What Could Go Wrong?
Politics
War
Inequality
What will people do?
Backs
Fingers
Brains as cybernetic control mechanisms for managing machines
Brains as routine paper-shuffling control mechanisms
Smiles
Ideas
There will be jobs: nothing guarantees they will be well paid
"Peak horse"
Prime-Aged Male Employment


No comments have been added yet.
J. Bradford DeLong's Blog

- J. Bradford DeLong's profile
- 90 followers
J. Bradford DeLong isn't a Goodreads Author
(yet),
but they
do have a blog,
so here are some recent posts imported from
their feed.

