The Graphic Continuum - Desktop Version
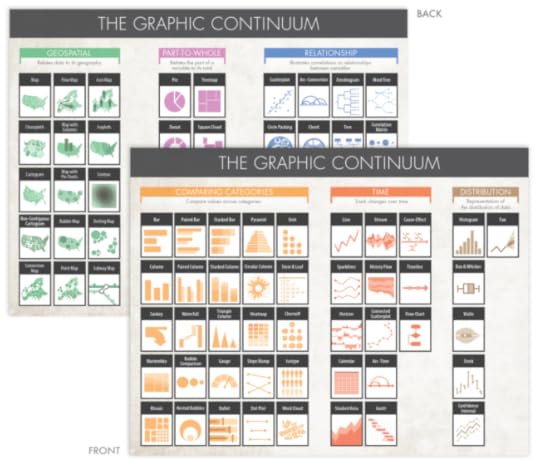
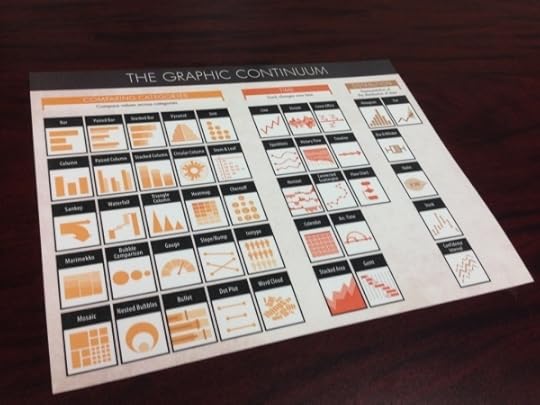
Jon Schwabish and Severino Ribecca have released a full-color, double-sided, laminated 8.5”x11” desktop version of The Graphic Continuum, available for only $10 until the end of the year when the price will go up to $13. This is a smaller version of The Graphic Continuum poster they released earlier this year.
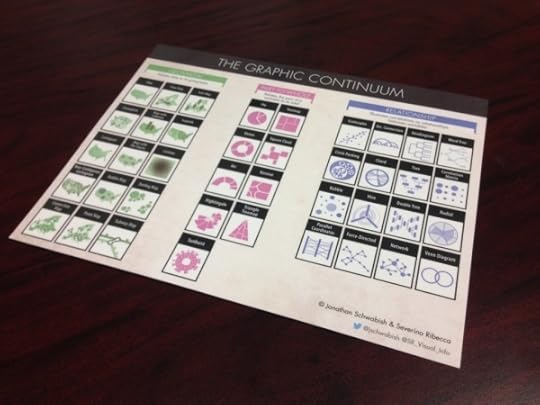
Nearly 90 graphic types grouped into 6 categories on a laminated 8.5”x11” sheet. It does not include every type of graphic, nor does it display every type of link between visualization, but it serves as a thought-starter. Use it to develop ideas, consider different options, or simply as a piece of art.
A fantastic reference of data visualization methods to give you some ideas for ways you can visualize your data differently.