
A Farewell to Arms?
No more military Keynesianism after G.W. Bush?
It is one of the strange paradoxes that those who disbelieve that government spending can stimulate the economy are sometimes the same individuals that believe reduced defense spending can decrease economic activity. (G.W. Bush is not subject to this criticism; see [1].) Well, internal consistency has not always been a strong suit for some. What is interesting is that, proportionately, spending on national defense has declined substantially; my view is that this has resulted in some drag in growth. Figure 1 shows the trends in defense expenditures (on consumption and investment).
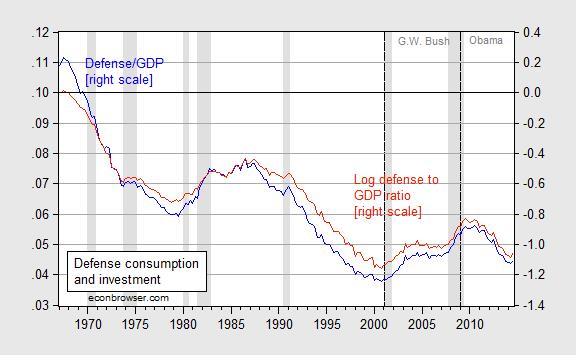
Figure 1: Nominal defense consumption and investment as a share of nominal GDP (blue line, left scale), and log ratio of real defense spending to real GDP, 1967Q1=0 (red line, right scale). NBER defined recession dates shaded gray. Source: BEA 2014Q3 2nd release, NBER, and author’s calculations.
An accounting decomposition of expenditure contributions of defense consumption and investment confirms the net deduction from that category.
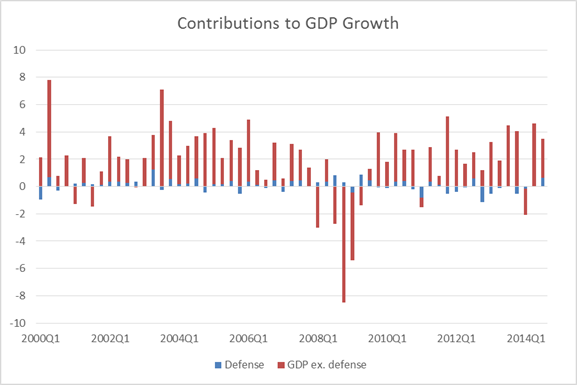
Figure 2: Contribution to GDP growth of defense (blue), of GDP ex.-defense (orange), q/q SAAR, %. Source: BEA 2014Q3 2nd release, and author’s calculations.
Of course, this is just an accounting decomposition. In economic terms, defense spending would account for even more if the multiplier for defense consumption and investment expenditures is greater than that for civilian spending (possible) and transfers (likely). One estimate of the defense spending multiplier is 1.5 [2] (See a discussion of military Keynesianism back in 2007 here).
Taking into account this trend makes the current recovery look much better as compared to the previous. Here I take a normative stand — that defense expenditures might have a different weight in aggregate welfare than non-defense. Figures 3 and 4 depict trends in output and output ex.-defense consumption and investment, for the current (blue) and previous (red) recoveries.
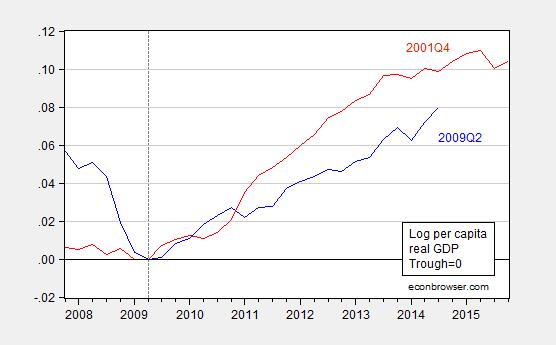
Figure 3: Log per capita real GDP normalized to zero at trough at 2009Q2 (blue), at 2001Q4 (red). Source: BEA 2014Q3 2nd release, and author’s calculations.
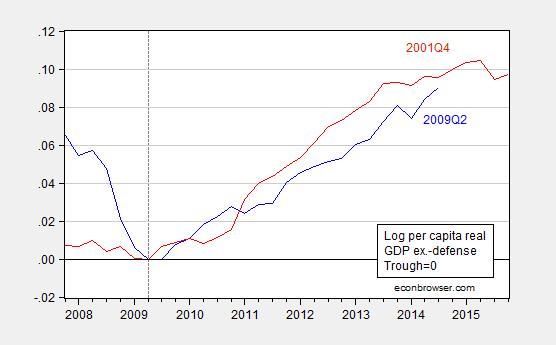
Figure 4: Log per capita real GDP ex.-defense normalized to zero at trough at 2009Q2 (blue), at 2001Q4 (red). GDP ex.-defense calculated using Törnqvist approximation. Source: BEA 2014Q3 2nd release, and author’s calculations.
The cumulative growth in per capita output is 1.9% less than that at the corresponding point in the previous recovery. But taking out defense spending (once again in an accounting sense), one finds that the gap is only half a percentage point. Taking into account multiplier effects would likely shrink the gap. (Note: the GDP ex.-defense variable can not be calculated by simply subtracting the Chain weighted defense consumption and investment from Chain weighted GDP; see this post.)
The foregoing not an argument for more defense spending — especially misdirected spending [3] [4]. Rather, it’s another reason for why the recovery has been so slow (in addition to the contractionary impact of state and local level government spending. [5] [6])


Menzie David Chinn's Blog


