Doctor Who Series 8: The Ultimate Poll Results Thing
James Lomond is a writer at Kasterborous Doctor Who News and Reviews - All the latest Doctor Who news and reviews with our weekly podKast, features and interviews, and a long-running forum.
Lies, damned lies and statistics! How you rated Series 8…
Attention, Kasterborites. You have been scanned. Assessed. Understood… your limits and capacities have been extrapolated.
Well not exactly. And we don’t have a Pandorica waiting for you. BUT we have had an obsessive rummage through your voting habits and some interesting factoids have emerged…
We recently asked you to vote your top 3 stories from Series 8 and this has given us a good idea of what the *most favoured* few episodes were. We also know that Capaldi heads the list as your favourite actor to play the Doctor of all time (excellent taste, may I say) and his debut season was the one you rated most highly compared to his two predecessors. But when we ask you about your top three, that’s what we’re going to find out. We don’t find out what you felt about the other episodes that you didn’t vote for. There’s missing data! But we have been asking you to vote for each episode as they aired….
The Kasterborous Poll asks you to rate your enjoyment or how good you thought each episode was on a 5 point scale. In saucy Kasterborous style we label each point with tags like “Superb!” at the top and “when is Matt Smith coming back?” at the disgruntled end…
The tags are a whimsical but in general I think most of you will interpret the poll as broadly divided up into: Best / good / average / bad / worst. And being a sci-fi geek, I’m a bit into numbers – juicy, debatable, revealing numbers!..
Running with the idea that you good people use the poll in a vaguely uniform manner, we have sucked some numbers out. This has involved some common sense (I like to think) assumptions whereby I’ve assigned a score out of 100 to each of the 5 voting options. Best = 100, Good = 75, Average = 50, Bad = 25 and Worst = 0.
This allows us to calculate an average score for each episode based on how many people voted for each number. These averages are the Kasterborous Appreciation Index or KAI.
But first a warning. This can ONLY represent how you, goodly Kasterborites, appraised each episode. It’s supposed to tell us something about what the average Kasterborite thinks about each episode. It’s doesn’t tell us anything else.
Secondly, it’s a single number taken from a range of votes – some episodes split opinion with two peaks of “Best” and “Worst” depending on what rocks your world and what leaves you baying for the show runner’s blood. Some of these numbers represent a compromise between a group who really enjoyed and episode and a group that found it mortally wounded their fan-soul. The thing this is best for is comparing how each episode compared week-on-week rather than how people tend to feel about episodes looking back on them.
With that in mind. Here are the scores:
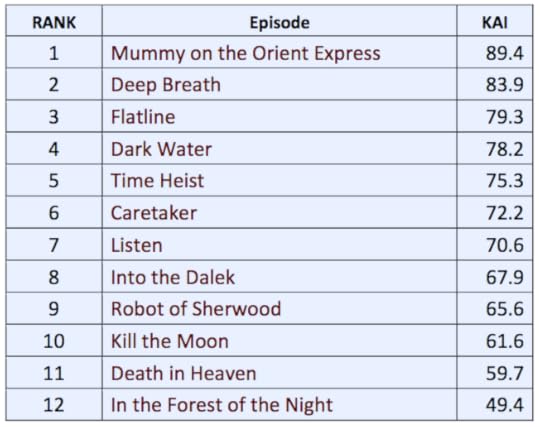
Kasterborous Appreciation Index
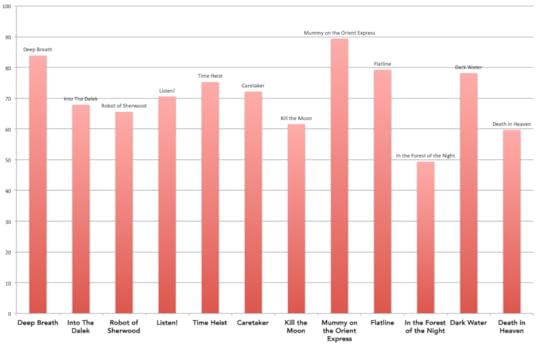
Now, there are a few things to take away from this chart. First off, the rankings…
NUMBER ONE:
Your totes-the-BEST episode was Mummy on the Orient Express with KAI 89.4. Head and shoulders above the rest…
NUMBER TWO:
The second episode you most enjoyed at the time of airing was series opener, Deep Breath with KAI 83.9.
NUMBER THREE:
After that, Mathieson nips in for Bronze with his multi-dimensional ode to Banksy, Flatline.
Following in descending order we have Dark Water, Time Heist and The Caretaker all coming in as the *better half* of Series 8, scoring KAIs above the average rating of 71.1.
Note that this contrasts with the Top-3 Poll you recently voted on, taking the whole series into account. The rankings when you voted for your stand-out three were 1st Mummy on the Orient Express, 2nd Listen and 3rd Flatline. Mathieson continues to reign supreme, but people were far more excited by Deep Breath at the time it aired, and Listen seems to be gaining potential “Classic” status now, after a more muted response at the time.
Something else interesting is that the big finale, Death in Heaven, fared much worse at the time of broadcast than the retrospective Top-3 poll. The post-broadcast KAI was the second lowest at 59.7 whereas the poll ranked it 5th out of the whole Series. This may be because people who found something they disliked (Cyber-Brig and Love-Conquors-All were offenders for some) would be more motivated to vote whereas those who quite enjoyed it were less bothered about expressing this online. And we know some of you were really upset(!) It might also be that a bit of time and re-watching allows people to work through things that shocked or appalled at the time and episodes can grow on them. Like a good wine, some episodes may improve with age…
Another interesting thing to note is the sudden drop from Death in Heaven’s KAI of 59.7 to the lowest score of 49.4 for In the Forest of the Night. In fact a score *below* 50% implies that overall the episode was felt to be on the not-very-good-at-all side of things rather than something worth watching. Damning indeed! But we should bear in mind that the script is only the starting point and there are a host of artistic decisions that go into what we see on-screen.
Mid-series science blasphemer, Kill the Moon came in with the third lowest KAI at 61.6. The comparatively poor performance of both Moon and Forest does suggest (going by the discussion they generated) that at least some effort to explain the preposterous is needed to keep us on-side with a story. Seems fair.
But wait! There’s more…
The “Not We”…
The joy of Appreciation Indices (yes, “joy“) is that they are independent of viewing figures and try to get a general feel for how the audience as a whole felt about the episode. If it were a general election and the episodes of Series 8 were in the running (if that was a thing) and, um, if only Kasterborites were voting, these would be the final positions!
But what of the “general public” – this mysterious and unthinkably Who-lite subgroup tend to muscle in on our show and apparently make up a large proportion of the audience.
The BBC calculates an Audience Appreciation Index based on a similar poll but out of 10 and expanded to a score out of 100. It’s similar to the KAI in that respect and is intended to reflect the average audiences enjoyment of a program. The BBC 1 average is 82.2 – anything under 60 is regarded as “poor” and over 85 is “excellent”.
Now – we can’t directly compare the KAI to the AI even though they’re both out of 100. We collect the data in different ways with use different sampling methods (5 voting options versus 10). Also there are a lot more people contributing to the BBC’s AI than the KAI (but quality not quantity, we say!) This may explain why the AI doesn’t seem to vary a great deal compared to the KAI – the AI scores for Series 8 have varied between 82 and 85 – far less dramatic than the highs and lows of your votes! Including a wide variety of people in the AI may lead it to hover around the same area. Though equally it could be that Kasterborites are more empassioned in their response to Who!
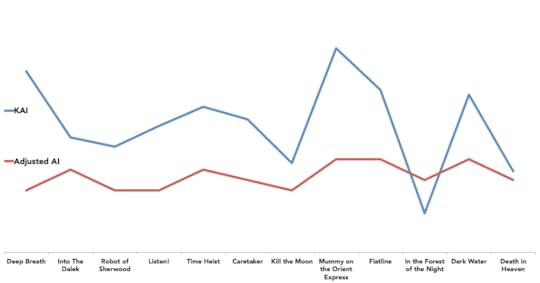
While we can’t *directly * compare the scores, we can look at their overall shape across the series – what were the highs and what were the lows? Take a look at this comparison of how you voted compared to the general public.
Week-on-week trend comparison
We’ve *adjusted * the AI figure in the chart below – it’s variation has been expanded so the ups and downs are more obvious. Also the scale has been removed as we really can’t compare them directly – it’s not that we were rating the episodes more highly in general (if anything the average KAI is 10% lower but shhhh! no – they can’t be compared…)
What you can see, is that the general public generally seem to agree with us about what was better and what was not so good… The overall shape – where it goes up and where it goes down – are pretty much the same. They agree that Time Heist was pretty good, they agree that Kill the Moon and In the Forest of the Night weren’t so great, and they agree that Death in Heaven was, overall, not quite as epic as Dark Water. Possibly something to do with a whopper of a cliff hanger that’s hard to deliver on…
In fact the main place where we differ seems to be on how awesome Deep Breath was with the KAI being very high compared to the scores for the rest of the series, than with the equivalent AI.
So there it is, Kasterborites. Your voting soul laid bare! There are, of course, lots of methodological issues with interpreting data of this kind and a limit to what we deduce. But it’s nice knowing what the numbers look like… (Any professional statisticians out there, please be gentle!)
How well do you think the KAI reflects *your* feelings on the show, especially on how each episode compared to the others? Does having some time to digest and re-watch change how you feel about episodes? And is there any anything else you’d like us to do with the numbers? Tell us below…
The post Doctor Who Series 8: The Ultimate Poll Results Thing appeared first on Kasterborous Doctor Who News and Reviews.
Christian Cawley's Blog
- Christian Cawley's profile
- 4 followers


