
Specificity Graphs
Harry Roberts recently wrote about creating a Specificity Graph to get a better picture of your CSS.
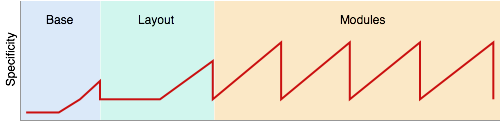
Harry’s conclusion is that a spiky graph is a bad graph. Spikes that occur mid-graph could lead to maintainability issues since CSS that occurs afterwards needs to meet or exceed that level of specificity to override earlier CSS.
In a SMACSS world, however, that’s not likely what your specificity graph would or should look like.
At the beginning of the graph, specificity starts out low with all the base element styles along with a few pseudo-class styles.
From there, the layout styles (generally just class selectors) will get added.
From there, each module gets added. It’s here where we start to see a teeth pattern emerge. Each module, depending on whether you use more of a BEM class-only approach, could be flat; or if you don’t mind using child selectors, the specificity will climb towards the end of the file. In the next module, the same pattern will happen again.
If you keep your modules isolated in design and implementation, then you really only care about specificity within a module, not across your entire CSS, making the overall site graph less useful.
High specificity in itself isn’t bad but is usually a sign of either being needlessly complex or having too many dependencies between rules. High specificity is only problematic when two rules with the same properties need to be applied to the same element—which is usually where designs become brittle.
If you'd like to create your own specificity graph, there's an online generator.


Jonathan Snook's Blog

- Jonathan Snook's profile
- 4 followers

